Analyzing SQL Server With New Performance Tools

Analyzing database performance on Microsoft SQL Server is quite a complex issue. In dbWatch Control Center, our primary aim is first to provide structure and toolsets to avoid running into performance problems in the first place.

Consistency in deploying preventative maintenance routines should take care of many problems that occur over time, such as index and table fragmentation. Bad statistics are a foundation that will ensure that we don’t waste time investigating preventable causes.

As most DBAs will know, unexpected performance issues can occur even with the best foundation, and we will need to be able to investigate the underlying causes.

For this reason, dbWatch Control Center has a lot of monitoring jobs focused on monitoring the behavior of different performance metrics. At its core, all performance issues occur when resource limits are met. It can be the CPU, disk, memory, or internal database limits.

The first we need to do to start our investigation is to find the time window where the performance issues occurred. The typical problem is that one or more SQL statements cause an overload of the database resources in the time period in which they were running. In this blog, we will briefly investigate performance issues due to SQL statements.

In the SQL Performance section in the management module of dbWatch Control Center, you can look at historical resource usage, together with the SQL statements that were performed in that time period.

Screenshot shows SQL Performance report.

In this section, we can see spikes in logical/physical reads and writes. This often, but not always coincides with performance loads. We can also look at other metrics in the same time frame, such as Time, the elapsed time for all queries in a time frame, which could indicate slow query response.

The Waits could indicate spikes where the database is waiting for specific resources. CPU, where we can see any spike in CPU load. Data cache where we can see if there was a fight for memory resources and other graphs focusing on metrics that could be relevant.

Once a peak has been identified, you can use the mouse to zoom in on the time period.

Zooming into performance time period

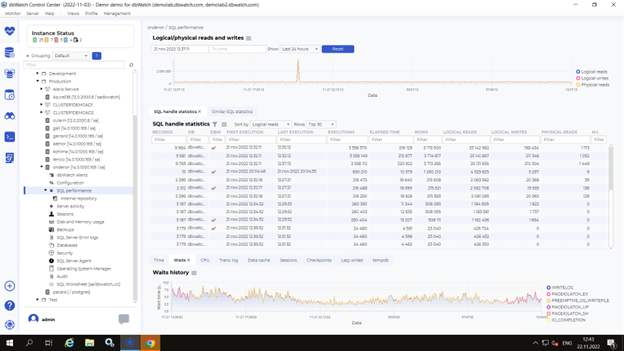
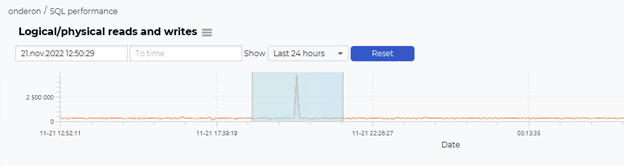
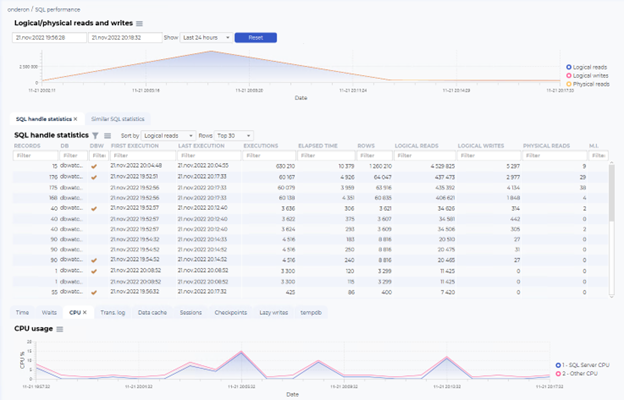
The SQL performance dashboard will then zoom in, and looking at the SQL handle statistics, it’s easy to see what SQL handle is responsible for this peak.

Finding which SQL is responsible for the peak

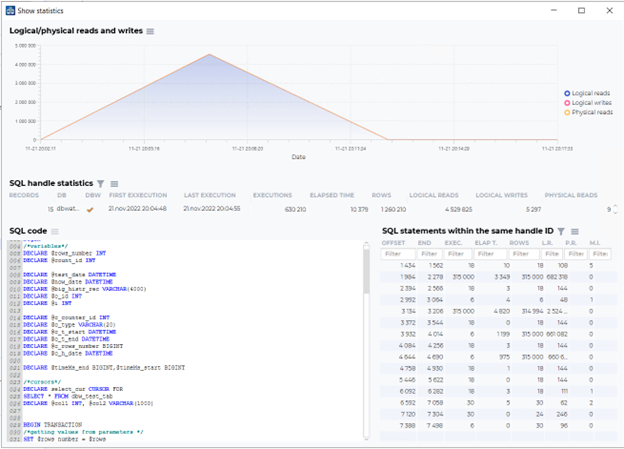
You can then right-click and select show statistics, to open the SQL handle and view the SQL code, statistics, and when the SQL statement is inside that SQL handle.
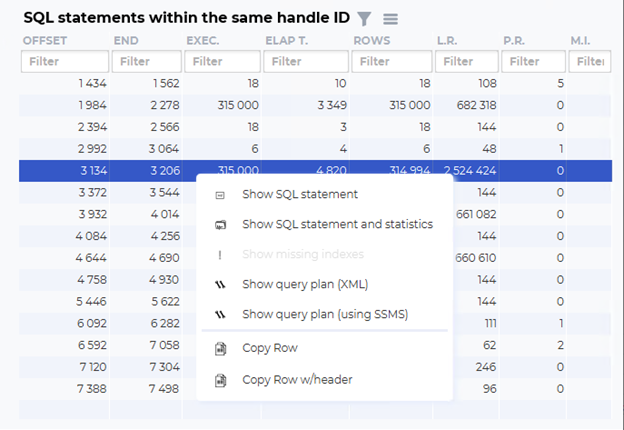
Viewing the SQL Statistics

If we here are interested in the SQL statement in this SQL handle that is causing the most logical reads, we can quickly identify it in the list and right-click to show this SQL statement or open the query plan in SQL Server Management Studio for further investigation.

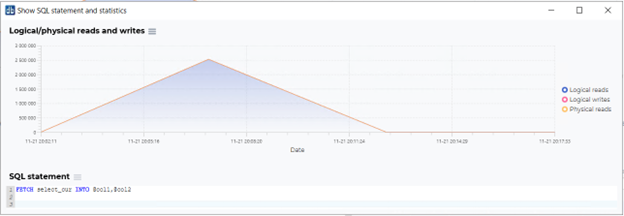
If we choose the “Show SQL statement and statistics,” we can open the SQL statement

In this case, it was the fetch statement in the procedure. We can see in the SQL code for the procedure that this is the select_cur which is defined as:

/*cursors*/

DECLARE select_cur CURSOR FOR

SELECT * FROM dbw_test_tab

DECLARE @col1 INT, @col2 VARCHAR(1000)

This allows us quickly to see what is going on, in this case, a select statement from a performance load routine, so nothing is out of what we expected.

If this was interesting, we go more in-depth on the SQL performance dashboard on the wiki page.

With dbWatch Control Center, SQLServer DBAs can monitor their resource usage trend and analyze the peak hours in their database environment based on available charts.  

Here’s an overview

  • Farm overview – consolidated views for performance, capacity, and maintenance for your entire database farm 
  • Monitor in-depth all your instances and platforms 
  • Performance – identify performance bottlenecks within the farm 
  • Scalability – ability to adapt to your growing database farm 
  • Alerting – alerting and third-party extensions tailored to your business requirements 
  • Security – role-based access controls, Active Directory, and Kerberos integration encrypts connections and support security certificates 

You can try dbWatch Control Center today.

Most Popular

Posts by Tag

See all

Social Media

On Key

Related Posts

Screenshot of dbWatch databse reporting tool

Database Reporting Tool: dbWatch Control Center

By regularly reviewing reports, organizations can identify potential risks before they become significant problems. Health check reports also maintain detailed historical records. These records are invaluable when there’s an issue or you need to understand past configurations

Managed Service Provider Reduces DBA Workload with dbWatch

In 2021, Ontario-based RPDATA Solutions began using dbWatch to manage their databases. It reduced their workload by 12 weeks annually, shortened customer deployment from weeks to hours, and streamlined management for larger clients with multiple platforms. dbWatch also automated reporting and provided proactive monitoring, improving efficiency across their operations.

a woman implements database scaling best practices

Mastering Database Scaling: Best Practices for Growth

Scaling databases is crucial for business growth, ensuring your IT infrastructure can handle increasing data loads and user demands. In this blog, we explore the best practices for database scaling. Learn how scalable tools save time and prevent bottlenecks while secure connections, proactive monitoring, and templates streamline management. Follow these expert tips to ensure seamless database expansion and performance.