


If you are a developer that deals with MySQL or a MySQL database administrator, you probably know what MySQL database engines are. One of the most popular database engines, as far as MySQL or MariaDB is concerned, is InnoDB. This storage engine is widely regarded as a high-performance storage engine that balances high performance with high reliability.
This storage engine replaced MyISAM and has been generally used in MySQL since version 5.5, which was released in 2010. This blog post will explore what MySQL offers in this space and how dbWatch can help monitor performance and reliability issues.
How Does InnoDB Ensure High Performance and Reliability?
If you ask a MySQL database administrator or developer how InnoDB ensures high performance and reliability, you will probably hear the term “ACID” mentioned. In the context of databases, ACID is an acronym for:
- Atomicity
- Consistency
- Isolation
- Durability
Here’s how InnoDB ensures that the ACID principles are followed:
- Ensures statements in a transaction operate as an indivisible unit, with their effects either seen collectively or not at all.
- Utilizes logging mechanisms to record all changes to the database.
- Provides row-level locking.
- Maintains log files to track all changes in the system.
It is worth noting that not all InnoDB engines are ACID-compliant “out of the box.” ACID compliance for InnoDB is controlled by the innodb_flush_log_at_trx_commit variable in my.cnf. This variable has three possible options: 0, 1, and 2. The default value is 1, which ensures ACID compliance. Using 0 or 2 can result in faster write speeds but sacrifices ACID compliance, risking up to one second’s worth of transactions during a system crash.
In general, the innodb_flush_log_at_trx_commit parameter controls how to perform fsync() operations. This Linux function ensures that all modified data is physically written to the disk, safeguarding data integrity after unexpected events like crashes or outages.
How Can dbWatch Help Ensure InnoDB High Performance and Reliability?
To ensure that your MySQL InnoDB instances maintain high performance and reliability, dbWatch offers several tools and jobs designed for this purpose. Here’s an example of performance jobs provided by dbWatch:
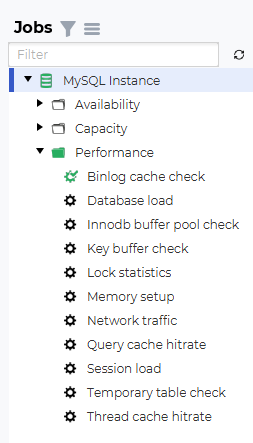
Image 1 – dbWatch Performance jobs
By expanding the Performance job section, you can monitor various aspects, including binlog cache, database load, lock statistics, memory setup, query cache hit rate, session load, and temporary table status. One critical job to focus on is the InnoDB buffer pool checking job.
Right-click the job, select Details, and you will see a detailed explanation of what the job does:
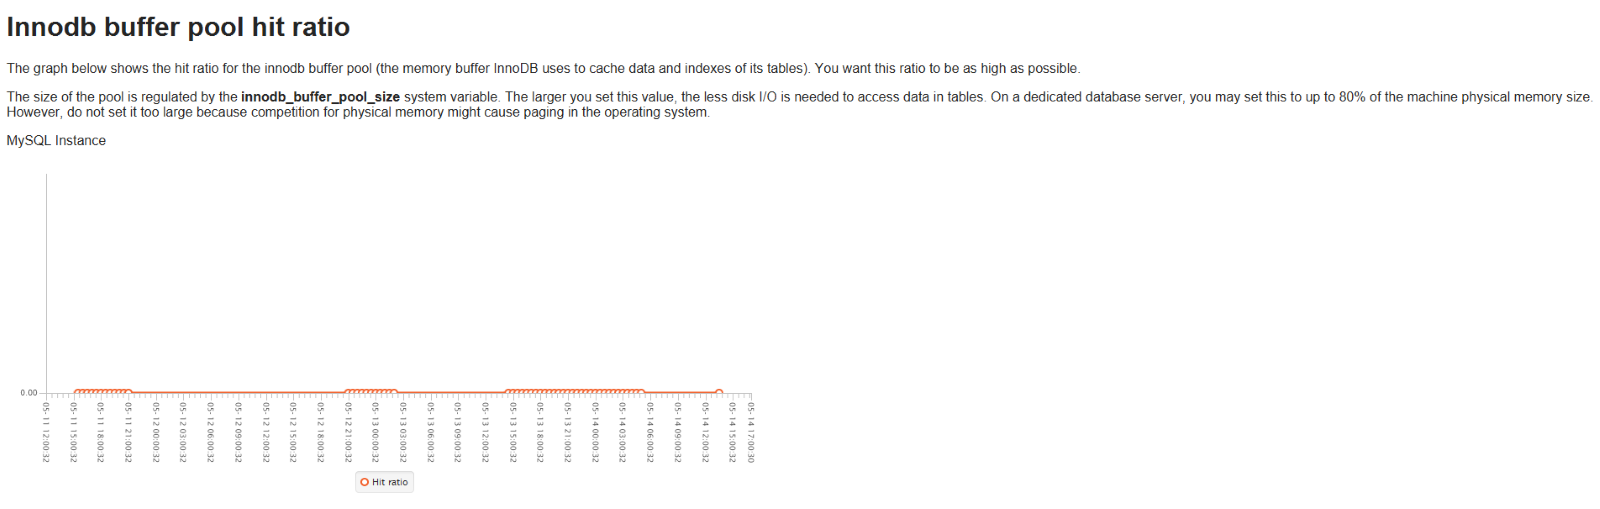
Image 2 – InnoDB buffer pool hit ratio details
The graph above depicts the hit ratio for the InnoDB buffer pool. To ensure high performance:
- Aim for a high hit ratio to minimize disk access, as queries hitting the disk are typically slower.
- Set a large InnoDB buffer pool value to reduce disk I/O when accessing table data.
To set these parameters correctly, use the free -h command to evaluate available RAM in your system. Allocate up to 80% of free memory to the InnoDB buffer pool on Linux (less on Windows). The more memory allocated, the more efficient InnoDB will perform.
dbWatch also provides a graph that illustrates the actual usage of the InnoDB buffer pool, showing the total read requests and how many accessed the disk:
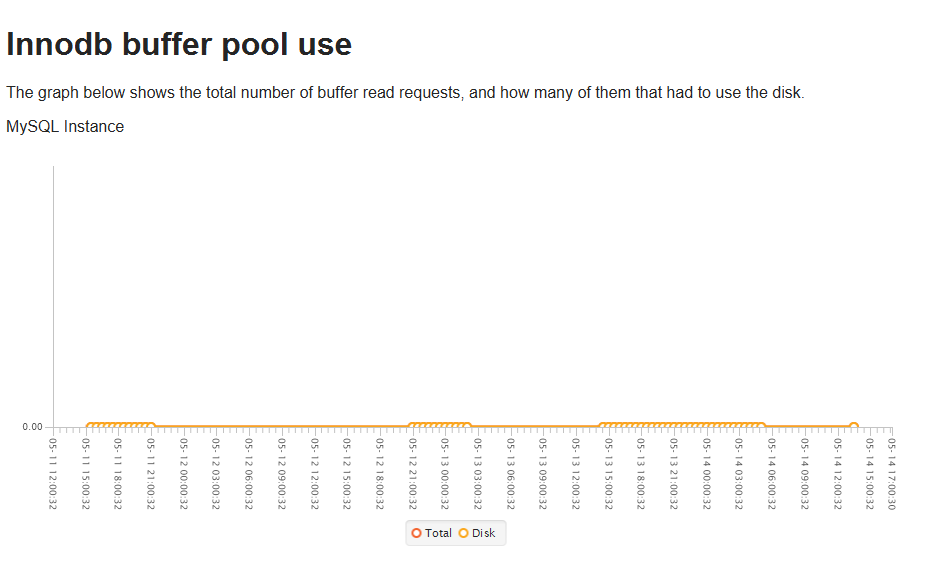
Image 3 – The usage of the InnoDB buffer pool
You can easily configure this job by right-clicking and selecting Configure. This allows you to set hit ratio alarm and warning thresholds:
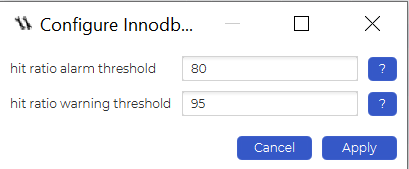
With dbWatch, you can receive notifications when the InnoDB buffer pool hit ratio falls below specific thresholds, ensuring you stay informed of potential performance issues.
Summary
InnoDB is widely known as a high-performance and reliable storage engine for MySQL. Leveraging tools like dbWatch Control Center helps ensure your InnoDB instances maintain these standards by providing advanced monitoring and performance management capabilities.
Keep your database instances running smoothly. Try dbWatch Control Center today.