Monitoring the status of database instances is the daily task of every database administrator or even a developer. Database monitoring these days can be incredibly complex and time-consuming if performed manually.
Thankfully, there are tools like dbWatch that can help you in time of need. If you are a user of dbWatch, you have noticed that it has a thing called “job statuses”: this blog post should provide some insight into it.
What are Job Statuses?
Job statuses in dbWatch, simply put, depicts how did a certain job in dbWatch execute – was it successful? Did it produce a warning? An alarm?
There are three categories of job statuses in dbWatch, and here is how everything works:
- Success means that the job ran successfully and can provide some interesting details on your database availability, capacity or performance if instructed to do so (simply right click the job and click Details to observe them in all their glory)
- Warning means that the job encountered some errors on the way (it might also mean that your database farms or instances are not up to par and can perform better – check the Details section as instructed above to learn more)
- Alarm means that something is (probably) terribly wrong – seeing such a job status means that something very bad is happening in your database farms and (or) database instances and needs immediate further attention. This job can negatively impact your database availability, capacity, or performance if left unresolved.
Statuses and Your Database Instances
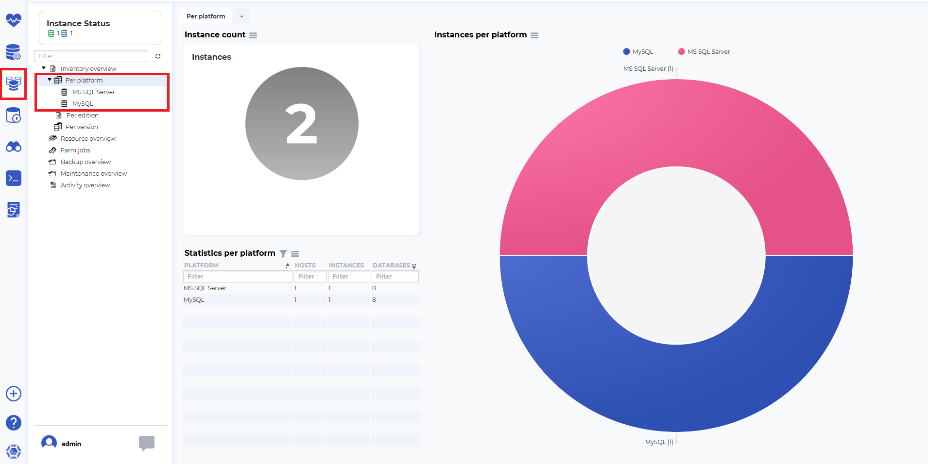
In order to check the status of your database jobs with dbWatch, you might first want to check what database instances you are running. To do that, click on the Database Farm icon (that’s the third icon from the top on the left-hand side), then expand per platform in the inventory overview section:
That way you will get a nice animated view of what database instances your servers are running!
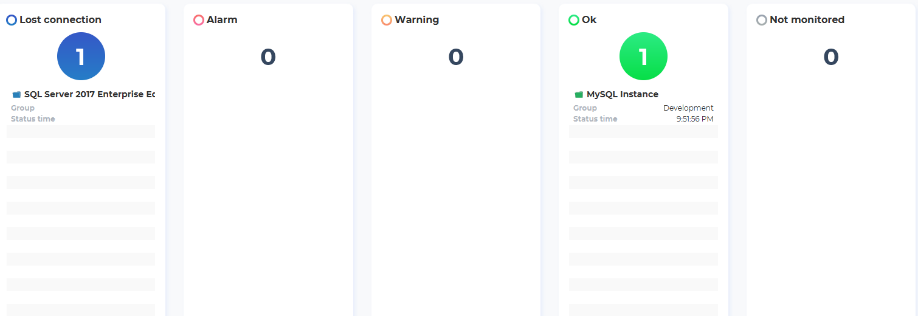
With dbWatch, you can also go back to the main page and observe the statuses of your database instances themselves (statuses are not specific to jobs, they can also be applied to database instances – keep that in mind!
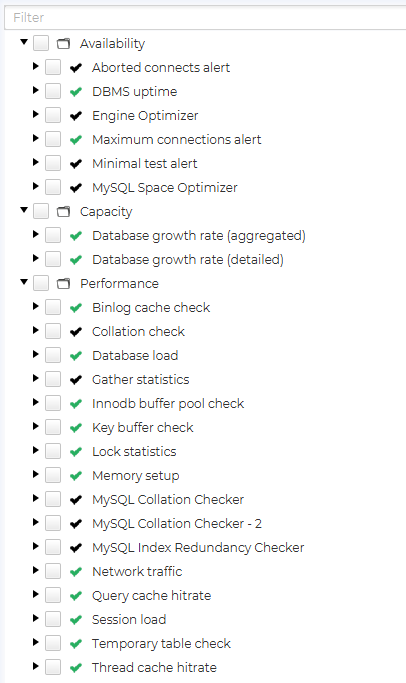
Once you have ensured that your database instances are running smoothly, it’s time to keep an eye out on your database jobs. Right click your database instance, click configure jobs and you should see an output similar to this one (black checkmarks mean that the job is installed, green checkmarks mean that it’s enabled):
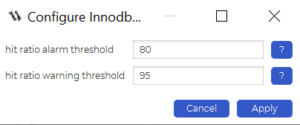
Once you have installed the jobs you wish to use on your database instance, it’s time to put them to the test! Choose a job you like, afterwards, you can configure it if you wish:
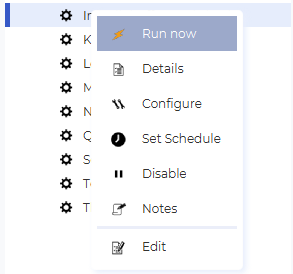
Finally, run it by right clicking on it and clicking Run now:
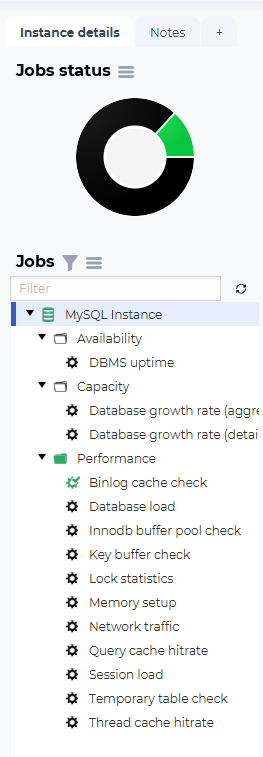
Once your job has been run, you will be able to see its status along with a comment on how well it was executed – a green setting icon with a tick mean that the job executed well, an orange setting icon means that the job produces some errors (check the details section to know what they are) and a red setting icon means that the job found something wrong with your instances:
Job statuses in dbWatch act as continuous advisors for your database, monitoring its availability, capacity, and performance to keep everything in peak condition.
Setting up job status monitoring is straightforward, and it helps ensure your databases run smoothly.
Learn how to leverage job statuses to maintain optimal database health and experience streamlined monitoring with dbWatch—start your free trial today!


