Locked databases and locks in SQL influence your database performance and challenge database management. Many elements are involved in database locks from row-level locks to entire database exclusions.
Identifying how the locks contribute to inefficiencies or bottlenecks might seem overwhelming. However, with a clear understanding of database locks, you can pinpoint critical issues and implement solutions with precision to ensure your database system operates optimally at every level of interaction.
This blog delves into the concept of database locks focusing on SQLServer, where locks are a common occurrence during transactions and can significantly influence both database and business operations.
By the end of this blog, you’ll have a comprehensive understanding of the different types of locks, their effects on transaction processing, and practical strategies for managing and resolving lock issues effectively. You can also see how a database management tool can be used to detect, manage, and prevent database locks.
What is a Database Lock?
Database locks are a critical component of database management. Locks help ensure data integrity and consistency because they stop multiple processes from simultaneously making conflicting changes to the data. However, while databases need locks, the locks can also introduce problems if not managed carefully.
The main problem with database locks is that they block. A transaction holding a lock often blocks other transactions from proceeding, which can lead to a cascading effect. Blocks can delay multiple transactions, impacting overall application performance and user experience. Simply put: Locks block.
How Databases Lock
Database locks occur to secure shared resources during transactions. Locks safeguard for databases because they:
1. Observe an all-or-nothing scenario for multiple and separate transactions
2. Preserve consistency in the database state
3. Isolate transactions from being committed until that transaction is complete
4. Save committed transactions even in the event of abnormal termination
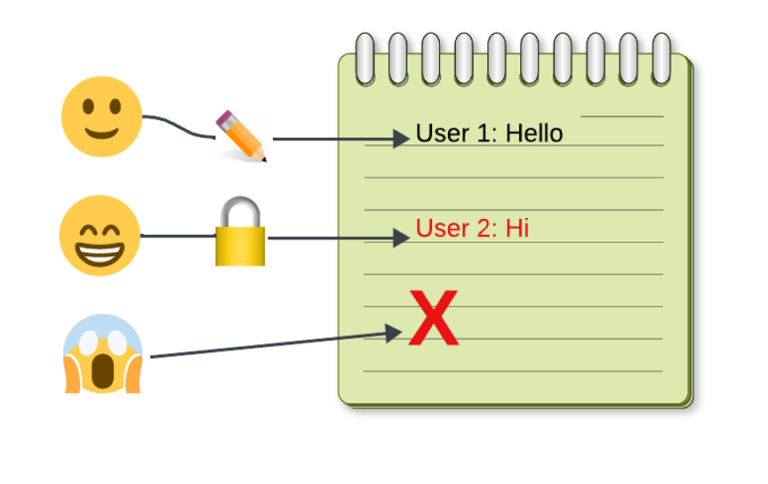
They adhere to the ACID properties (atomicity, consistency, isolation, and durability) of a transaction. To put it in perspective, imagine a piece of paper being shared by three writers.
The illustration below shows an example of how locks work. Writer One (🙂) finishes their message and gives the paper to Writer Two (😁). Then, Writer Two (😁) begins to draft their message. Now all other writers (🙂, 😱) are blocked. They must wait until Writer Two finishes before they can write anything. Locks work in the same fashion. They maintain data integrity by preventing simultaneous writing and updates.
Locks within Database Access Levels
Locks can occur in a variety of forms. They appear in levels of access to a database. Below is a short list of common locks.
Row Level Locking
Most common type of locking. It locks a row of a table.
Column Level Locking
Locks a column or columns within a table. Database vendors do not commonly offer this since it requires a lot of resources to apply it.
Table Level Locking
Locks an entire table. It prevents modifying the table properties or updating all the rows by another user.
Why Databases Lock
Database locks often appear during record updates or uncommitted SQL statements. They primarily isolate a database component, such as tables or parts of a table, so that session updates and alterations will successfully take effect and no data loss will be experienced.
Locks are not a problem when only a few active sessions transact in your database. However, with more database users accessing and utilizing your databases, locks will impact your database resources and potentially your business. There are three kinds of locking that we will discuss: lock contention, long-term blocking, and deadlocks.
Common Table Locks in SQL
Before diving in let’s make sure we all have a common understanding of table locks. After that is clear, we can start working on solving the problems.
Database Lock Contention or Long-Term Database Blocking
Lock contention refers to the bottleneck that happens when several database sessions are trying to access the same information. Waiting for other programs to finish accessing the information can cause a significant bottleneck in database performance.
A transaction holding a lock can block other cause long-term blocking of transactions from proceeding, which sometimes leads to a cascading effect which delays multiple transactions, impacting overall application performance and user experience.
Like Lock Contention, Long Term Blocking happens when multiple users access the same database component. The notable difference occurs when one user holds on to that component for a long time. Dependent sessions and objects will be blocked from reading and writing during this time.
Database Deadlocks
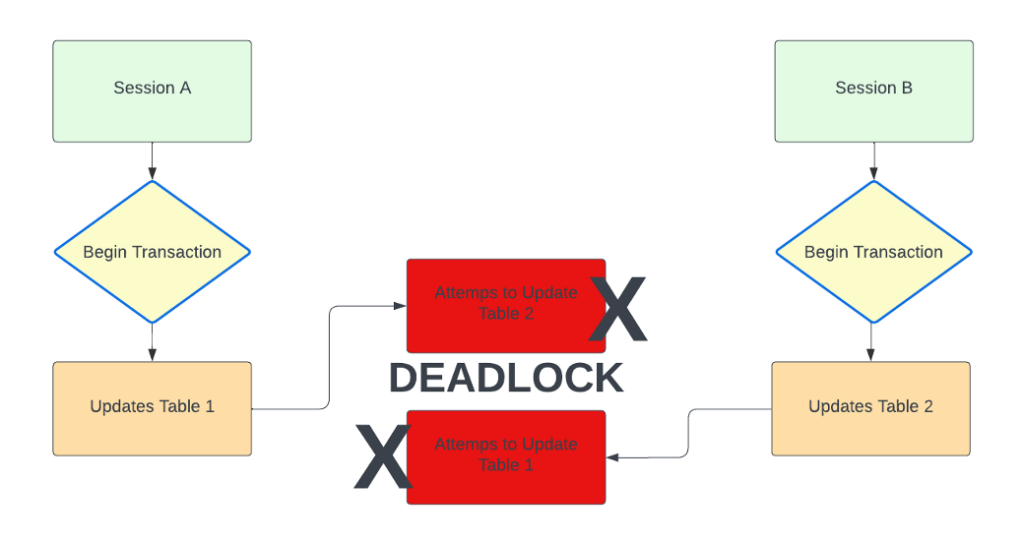
Database Deadlocks happen when transactions from two or more databases wait on each other to give up their locks. In this situation, they cannot roll back or commit, as neither can move forward.
Below is a simplified example.
– Session A acquires a lock on Table 1.
– Session B acquires a lock on Table 2.
– Session A then tries to acquire a lock on Table 2, but it is already held by Session B, so Session A is put on hold.
– Session B then tries to acquire a lock on Table 1, but it is already held by Session A, so Session B is put on hold.
– Both transactions are now waiting for each other to be released.
MS Management Studio and Database Locks
Microsoft SQL Server Management Studio (SSMS) is a comprehensive tool used for managing, configuring, and administering SQL Server databases. While it’s cost free, it is not built for working with a complex databases situation. However, it can be used to deal with database locks.
In this example with MS Management Studio, there are two separate sessions to act as the users. The screen shot below shows a simple query that locks the designated table test_table. Next User 2 executes another query for Session 2 that will select the specified table.
Use Master
GO
exec sp_who2
GO
The stored procedure above will display a tabularized format of information you need to show who is blocking who. As seen below, in Figure 2, ID 54 (session 2) is being blocked by session 76 (session 1).
Similarly, you can use the following query to get the information you want:
USE Master
GO
SELECT session_id, start_time, command, status, blocking_session_id, wait_time FROM sys.dm_exec_requests WHERE blocking_session_id <> 0;
GO
You will still end up with the same information as before. Make sure you identify the blocked session in the database before killing the query.
Remember, in queries using BEGIN TRANSACTION, you always have to save points after every critical alteration to the database. Also: end your transactions with ROLLBACK or COMMIT since the transaction affects these locked tables.
Finally, only kill sessions if they have minimal impact on your business operations and data dependencies. Killing a session is your last resort.
If you need that last resort, here are the commands:
KILL – – blocking_session_id
— in this example, two queries were executed:
— KILL 76
— KILL 5
— You can also use: KILL [session_id] WITH STATUSONLY
The session will restart after being killed.
After killing them, it will restart the session. This was also done by killing session_id 54 (session 1).
How to Deal with Database Locks and Blocks
Now that you better understand the kinds of locks and how they occur, you can see how to deal with them in dbWatch. Download a free version of dbWatch to try this in real-time.
Monitor Database Locks and Blocks
First, please open dbWatch and find the instance you want to monitor.
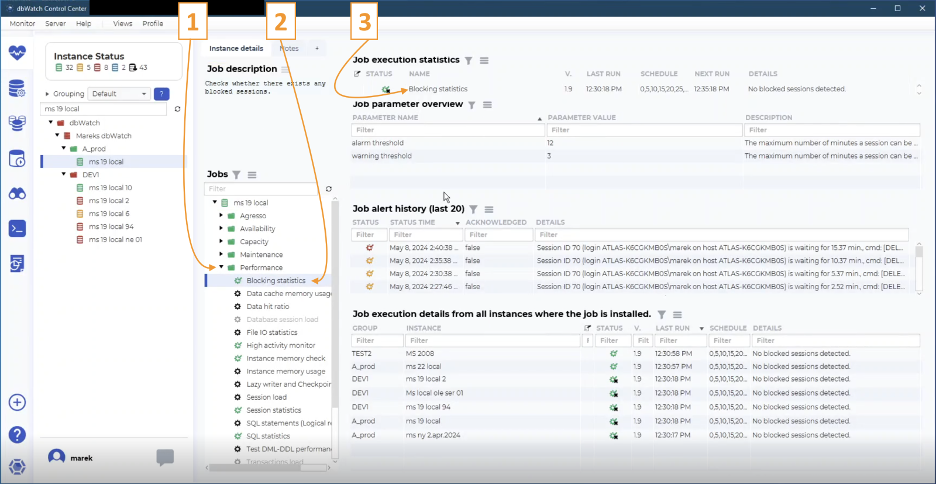
You’ll see three numbers in the screenshot below.
#1. Now that you’re in the correct instance, look in the ‘performance’ folder.
#2. Click on ‘Blocking statistics.’ After clicking on ‘Blocking statistics’ you can see the status of the job.
#3. Under ‘Job execution status’ You can see here that the system automatically checks for database blocked sessions by reviewing the active database locks. In this example, it checks every five minutes to see if any blocks are happening.
On either side of ‘Schedule’ you’ll see when the last check was run (12:30:18) and when the next run will happen (12:35:18).
For the next screen shot, we created a lock on this instance. While the session we created remains uncommitted, all other sessions are blocked.
#4. Shows you that the session is blocked. When you hover over the details, a pop-up box tells you the Session ID, where it’s located and how long the block has taken place.
#5. Here you’ll find the ‘alarm threshold,’ which is 12 minutes here; and ‘warning threshold,’ which is three minutes here. Depending on how you’ve configured dbWatch the alarms and warnings could trigger emails or alerts.
The status of the job here is still ok because the time threshold has not passed.

In addition to the alerts you’ve configured, you’ll find that the icon changes color to yellow (warning) shown below, or red (alert) as the block continues.

dbWatch always gives you an overview, then you can dig deeper. Let’s start by getting a report. (Screen shot below)
#6. Right click on the ‘Blocking Statistics’ line.
#7. Select and click on ‘Details.’
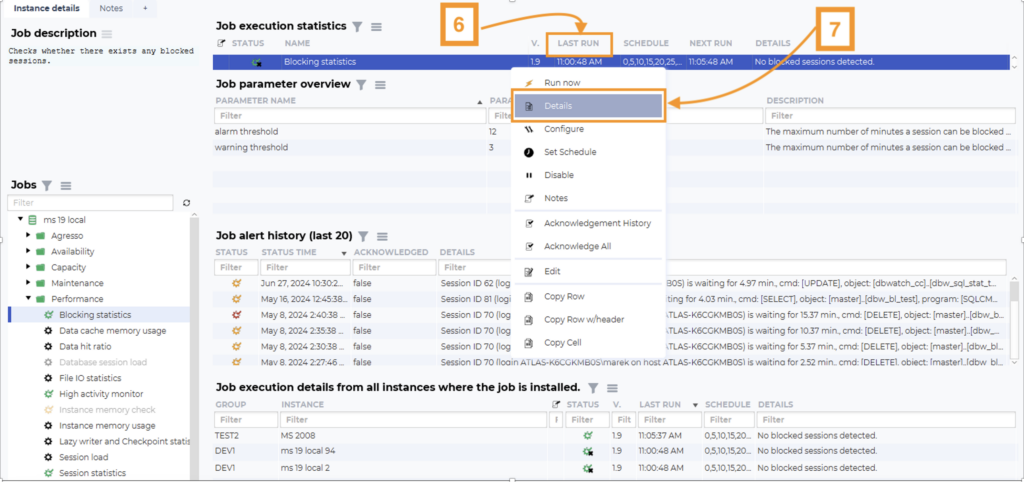
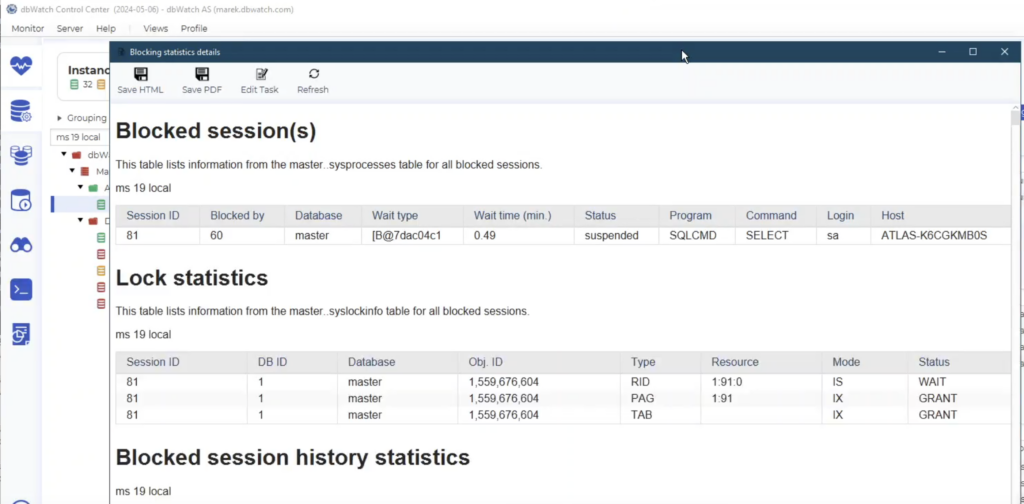
Now you’ll have all the details about the blocking session. (See screenshot below.) You’ll see the lock statistics, what kind of blocks there are, and the blocked session history. The session history clarifies what happened with any previous blocking.
You’ll also find the session number, what it has blocked, how long it’s been blocked, etc.
How fix Table Locks in SQL with dbWatch Control Center
So far, we’ve only monitored which tables are locked and creating blocks – basically extracting information. Now we’ll switch to managing and resolving the issues.
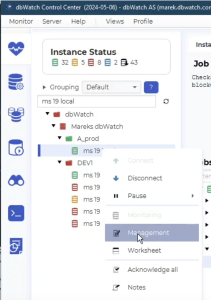
Right click on the instance you’ve been working on. You’ll see a drop-down menu. Scroll down to ‘Management.’
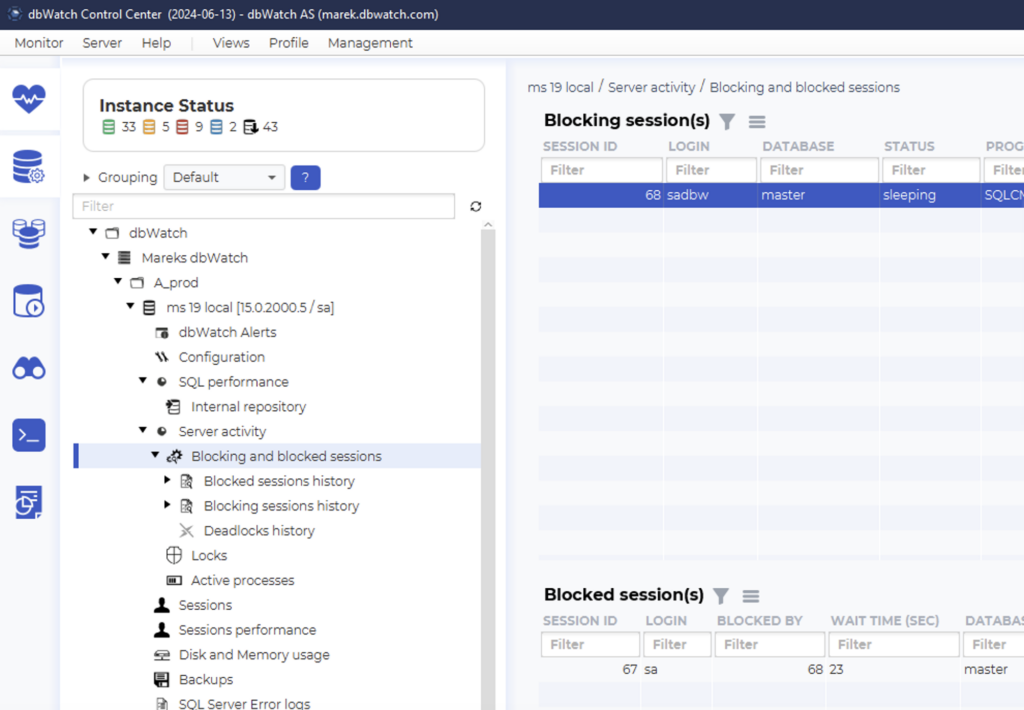
In Management, you need to go to the blocking sessions view. Navigate there from the left-side menu. Go to ‘Server Activity’ and then ‘Blocked Sessions.’ You can see details about the blocking and blocked session. You can decide which session to terminate.
Killing a Locked or Blocking Database Session
If a session is blocking or locked for hours, you should resolve it. Normally, the only way to resolve it is to kill it. But which session should you kill? The one who is waiting, or the one who is blocking?
Sometimes it’s a person causing the lock, but most often it’s a batch job. There isn’t a special science to deciding which session to kill. As a rule, if you know someone works with the locked or blocking instance, always ask them first.
Before killing a session, it’s often helpful to investigate the blocked session history and answer a few questions like:
– Where did the block happen?
– Which login was involved with the block?
– How often has it happened?
– Which program created the block? For example: if the program is SQLCMD, normally it could be a CRM system.
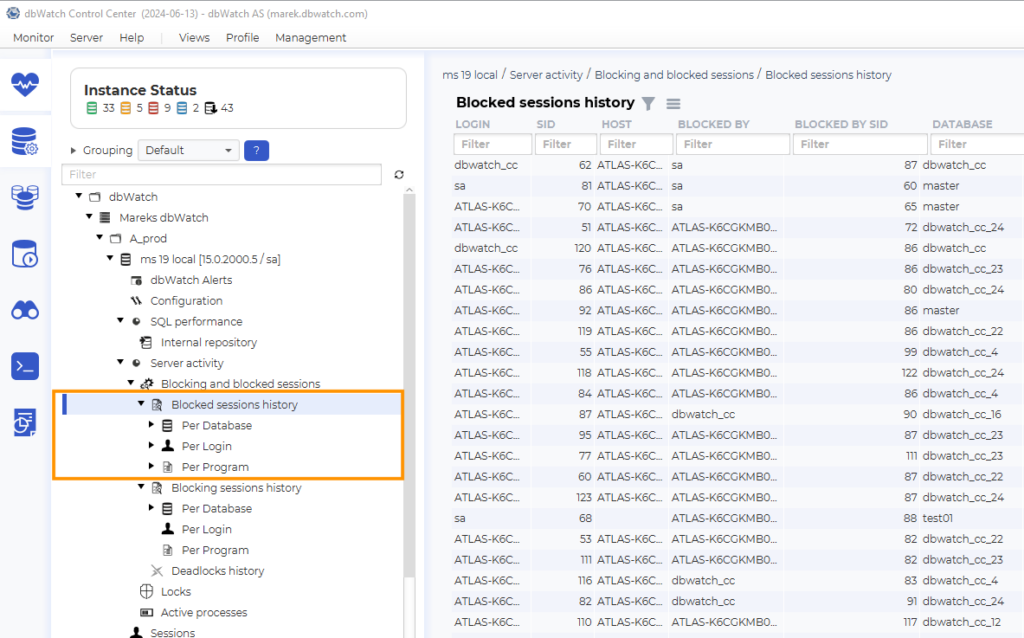
You can choose if you want to see the history of blocked sessions or blocking sessions. The blocked history tells you which sessions were blocked. The blocking history shows which sessions created the block.
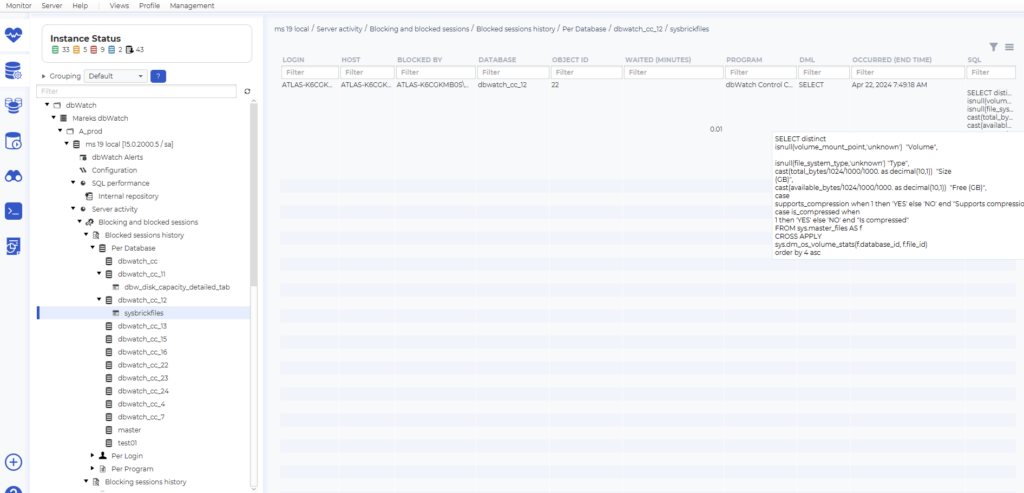
In dbWatch you can investigate what’s going on before you talk to someone. The filters are very helpful when digging into blocked and blocking sessions history. You can check the type of database, and which program, etc.
You can also check out these statistics in the side bar where you can view them per database, per login, or per program.
Finally it’s easy to kill a session in dbWatch.
First, go back to the blocking and blocked session overview. Now, choose to kill the blocking session or the blocked session. Do a right click on the session you want to kill and choose ‘kill session.’ Now you’re a successful session murderer, and the block is resolved.
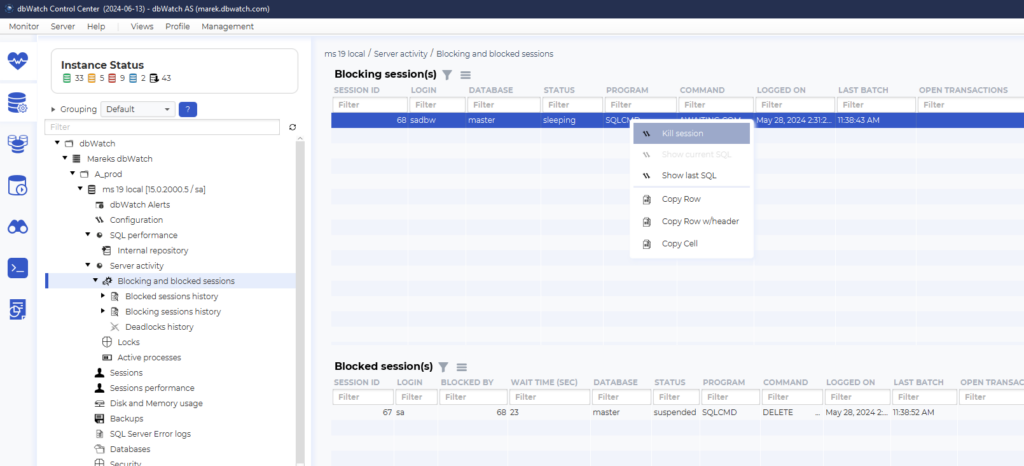
But wait! Before you relax, remember to check the statistics and history (below), just to see what kind of queries were running and what they were trying to do. If it’s relevant, pass this information to the product developer or the person responsible for that program so they’re aware of the problem.
Effectively managing database locks is crucial to maintaining optimal performance and preventing bottlenecks in your SQL databases. By monitoring, analyzing, and resolving locks using tools like dbWatch, you can ensure that your databases run smoothly and efficiently.
With the right approach, you can stay on top of potential problems and maintain a healthy, high-performing database environment.
Stay ahead of database bottlenecks! Sign up for a free dbWatch trial and see how it can help you.

Solve SQL Server Blocking with dbWatch SQL Performance Package
SQL Server blocking is a persistent challenge for DBAs, but with the right tools identifying and resolving issues becomes faster and more intuitive.

Q1 2026 Release Notes: Key Improvements
The March 2026 release introduces several improvements across monitoring, troubleshooting, and administration in dbWatch. It makes it easier to investigate performance issues, manage access, work across distributed environments, and integrate dbWatch into existing monitoring workflows.

Database Decommissioning Checklist for SQL Server
A practical SQL Server database decommissioning checklist that shows how to safely find and retire unused databases.
Copy to a Test Environment From Production
Automate the cloning of production SQL Server databases to test through a controlled backup to shared storage and restore workflow. Schedule repeatable refresh jobs, keep environments current for patch and release testing.

Q4 2025 Release Notes: Key Improvements
We’re wrapping up the year with one final, large release. Discover the highlights in the blog below.

Eliminate Database Alert to Fix Time
How dbWatch Control Center speeds up database alert to fix time by creating a direct path from monitoring to action, cutting out VPN hops and extra tools.


