Database Locks – how to monitor and manage it

Tweet
Share

Database locks have been a bane to most DBAs. They cause unnecessary problems to databases and business processes. In this blog, we will examine what database locks are, issues that can arise from them, and provide ways how to deal with them on SQLServer. Not only that, but we will also implement it in dbWatch Control Center as an example.

What is a database lock?

Database locks occur to secure shared resources during transactions. Locks are safeguards for databases as a means of: 

  1. Observing an all-or-nothing scenario for multiple and separate transactions
  2. Preserving consistency in the database state 
  3. Isolating transactions from being committed until that transaction is complete.
  4. Saving committed transactions even in the event of abnormal termination
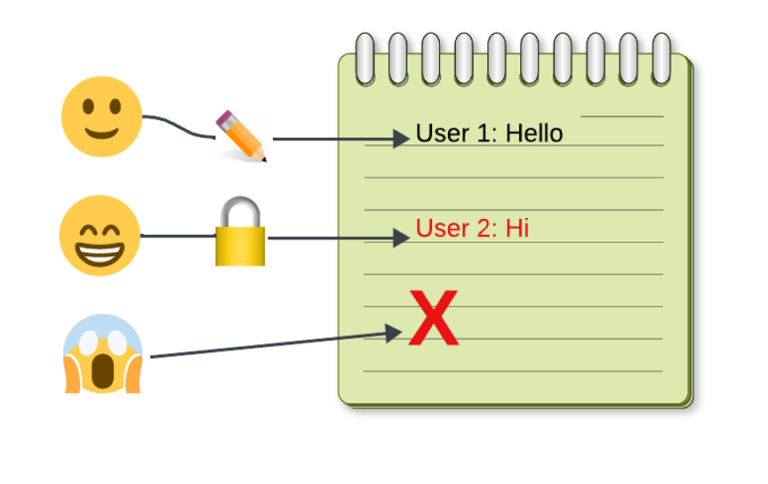
They adhere to ACID properties of a transaction. To put it in perspective, imagine a piece of paper being shared by three writers.

The first writer finishes his message and gives the paper to the second writer. Then, the second writer begins to draft his message. In contrast, the last writer must wait for the second writer to finish his message before writing anything on that paper. Locks, like the above example, work in the same fashion. They prevent simultaneous writing and updates from maintaining data integrity.

Locks can occur in a variety of forms. They appear in levels of access to a database. Below are the kinds of locks that can occur:

Database locks most commonly appear during record updates or uncommitted SQL statements. They primarily isolate a database component, such as tables, so that session updates and alterations will successfully take effect and no data loss will be experienced. Locks are not that problematic when only a few active sessions transact in your database. However, with more database users accessing and utilizing your databases, locks will impact your database resources and potentially your business. There are three kinds of locking that I will discuss: lock contention, long-term blocking, and deadlocks.

First, we will discuss the most common form of locking: Lock Contention. It happens when concurrent sessions compete for the right to update the same data. As we have discussed earlier, locks are enforced when a user alters a table property or updates data. This, in turn, blocks other session users from accessing that same database component, i.e., table. SELECT and INSERT statements run slower when accessing that table as it waits for the lock to end. Worse, lock contention may lead to indefinite access to a particular table and high CPU usage on that database server. This leads us to the second kind of locking – Long Term Blocking.

Last, we have Deadlocks. Database Deadlocks happen when two or more database sessions hold to a database object dependent on their transaction. Hence, neither session can continue unless the other concedes hold of that dependent object.

The Figure above simplifies how deadlocks occur. Database Management Systems (DBMS) can detect deadlocks. It will select a session and roll back that session’s transaction. The only caveat is DBMS will choose the easiest transaction to roll over.

Sure, deadlocks are manageable when it concerns user-driven ad-hoc. But, when applications and SQL jobs are involved, this can lead to data loss and logic problems. Transactions highly dependent on timing and data will always lead to writing or outputting incorrect information.

What can I do when database locks occur?

Now that we have a better understanding of the kinds of locks and how they occur, we can discuss how to deal with them and prevent them in the future. Before that, let us simulate how a lock can occur in a session.

In this example, I have prepared two separate sessions to act as our users. Session 1 will designate as our first user; then Session 2 will be our second user.

The figure above shows a simple query that locks the designated table test_table. After that, we will execute another query for Session 2 that will select the designated table.

				
					Use Master
GO
exec sp_who2
GO


The stored procedure above will display a tabularized format of information you need to know who is blocking who. As seen below, ID 54 (session 2) is being blocked by session 76 (session 1).

Similarly, you can use the following query to get the information you want:

				
					USE Master
GO
SELECT session_id, start_time, command, status, blocking_session_id, wait_time FROM sys.dm_exec_requests WHERE blocking_session_id <> 0;
GO


You will still end up with the same information as before.

After knowing the blocking session, you can kill the query by using the command below:

				
					KILL - - blocking_session_id
-- in this example two queries were executed:
-- KILL 76
-- KILL 54
-- You can also use: KILL [session_id] WITH STATUSONLY


After killing them, it will restart the session. This was also done by killing session_id 54 (session 1).

That seems more straightforward than expected. But this is still a bare-bone example with a negligible impact on our business processes and databases. In reality, killing a session rolls back the transaction before changes in the database state. Use killing with precaution since it may take longer for the session to recover the lost transaction, and it may affect dependent objects during data updates and writing.

You should have sufficient knowledge when dealing with table locks. Do not casually kill the session to have a quick-fix solution to the problem. In queries using BEGIN TRANSACTION, you always have to save points after every critical alteration to the database. Do not forget to end your transactions with ROLLBACK or COMMIT since these lock tables are affected by the transaction. Finally, only kill sessions if they will have minimal impact on your business operations and data dependencies. This serves as your last resort.

Another option is to utilize database monitoring and management tools such as dbWatch Control Center. This not only saves you time with querying for information but also gives you an overall view of the state of your database.

How to do it with dbWatch Control Center?

Since dbWatch Control Center is both a monitoring and management solution, we will do both in one active window. For reference, we will simulate the previous example step-by-step using Control Center.

First of all, we will change both the warning threshold and the alarm threshold. The above picture shows the default values of the blocking statistics. This means that a warning status will appear when blocking occurs for more than 5 minutes, and it will raise an alarm status when it is above 30 minutes.

I will be altering it to notify me as a warning when it reaches 4 minutes and alarms me when it reaches over 12 minutes.

To show how that blocking has occurred, the screenshot above shows that the blocking has already taken effect.

Using the query before, I checked if table locks were occurring in the database, and there are. We now know that session 75 is blocking session 58. For the following steps, we will not need any Management Studio opened. These previous two screenshots are only here to confirm that table locks are occurring.

In the monitoring module, the blocking statistics job will check if table locks are occurring in the database. As we defined earlier, the monitoring job warns us after 4 minutes of blocking has happened. By clicking on the blocking statistics, it shows a complete overview of the following:

  • Who?    –>  which sessions are blocking who
  • What? –> what query is being executed
  • Where? –> what management tool host is this occurring in when the blocking has occurred

After waiting a little while, the status is changed to alarm, indicating that it has already passed the 12-minute mark.

Now, we will go to the monitoring module. Click on the tree. Then, find “Performance” and click on the arrow adjacent to it. Underneath it, you will find “Blocking Session.” Click on the arrow beside Blocking sessions to display “Blocking Session History,” which will help us determine if logs are present during the lock. As we can see in the above screenshot, the lock was recorded and sorted starting from the latest blocking.

After confirming the logs, we will go back to “Blocking sessions” to manage our database. On that view, two separate sections will appear – “Blocking sessions” and “Blocked Sessions.” One record should appear in each section. By right-clicking on the record, you have the option to “Kill the session” or “Show current SQL”. For now, we will not kill the session. We will investigate further.

Upon checking both sessions by utilizing “Show current SQL”, it shows that session 2 (SPID 76) is only making a select statement while session 1 (SPID 58) is blank, indicating that a transaction is being done. Knowing this, I can either terminate session two since it only makes a select statement or terminates session 1 to stop the transaction. In this example, I killed session 2 since it’s only a select statement.

Upon checking it, session 2 has been terminated, releasing the lock in the process. Session 1 continues to execute its transaction.

In summary, tools like dbWatch make it much easier to deal with locks. You get alarm notifications and quick insight into the situation, and the ability to resolve the issue at hand quickly.