


At dbWatch, we believe that software, much like a well-tuned database query, shouldn’t stagnate. That’s why we’re rolling out our latest release. This release is a direct response to the brilliant, sometimes very specific feedback from our users … yes, we’re looking at you, the folks who email us at 3 AM with feature requests written in SQL syntax.
Your opinions matter, because let’s face it. If our users aren’t happy, we’re just a bunch of engineers staring at logs, wondering where it all went wrong.
Without further ado, here’s a quick overview of the new and/or improved features.
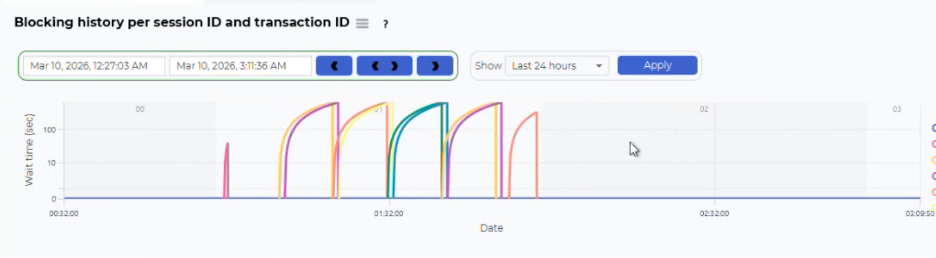
Blocking Detection
See full granular views of your SQL Server blocking events with the Blocking Event Collector. It captures blocking chains, lock types, and session details, storing this data for historical analysis. The default collection interval is set to 10 seconds but can be adjusted to match your monitoring requirements. The tool retains two weeks of history by default, balancing storage efficiency with the need for sufficient context during troubleshooting.
Logarithmic scaling in the visualization ensures that both short-lived and long-running blocks are clearly represented, allowing you to identify patterns, outliers, and recurring issues. Drill-down capabilities give you detailed inspection of individual blocking events, including the ability to trace blocking chains, review session histories, and analyze wait events. This level of detail supports root-cause analysis and facilitates collaboration with development teams to address underlying issues, such as inefficient queries or suboptimal locking strategies.
Read our blog about understanding SQL Blocking in dbWatch.
Query plan for SQL Server
This new drill down feature is used in SQL statement, SQL performance module, and Visualizes execution plans for improved insight into performance issues.
Focused and Automated Privilege Management
You can create users, change what they can access, and manage what privileges they have in the command line. Instead of using the GUI, you can integrate with other authentication systems. This gives you more efficient and better integration with other systems with the possibility to use automation.
Better Drill Down for Management Charts
Better zooming and time management in the management charts. Improved readability with hour and day markings directly in the time-based charts, and improved zoom controls in management.
Better Network Layout View
In large and complex dbWatch installations it can be difficult to keep track of how the network communication between the different dbWatch Servers is configured. For example, if redundant network paths are set up. This view tells you how exactly your installation is configured. This is useful when you need to document your installation of when you are debugging network connection issues.
New Visual Integrations
Two integrations are available. Prometheus collects data over time and stores it in the database. Grafana asks for data, for graphs and then shows it.
Streamlined Time Zone Handling
Earlier the time zooming used the local time zone of the dbWatch Monitor and the data was displayed in the time zone of the database. We agree that this could get a bit confusing. Now both the zoom controls and the data is displayed in the time zone of the database.
