


Online transactions are the new normal. From banks, retailers, and the food industry, Information Systems have adapted with the times to comply with customer demand.
However, not everything is fine in the state of this “new normal.” The increase in demand could lead to degradation in your database performance. Most commonly, this is observed as a slow-running database that visibly impacts the performance of top-level applications.
What is database slowness?
Let’s discuss database performance first. Database performance refers to the speed at which your database responds to a request for accessing its stored data. To visualize it, a simple SELECT statement, when executed, pulls resources from your database and returns tabulated data for display. This works well for the first thousand records, but when querying tens of thousands of rows or more, reduced performance can often be noticed.
Database slowness is a symptom of stunted performance. The key difference between a simple SELECT statement and database slowness is that the latter represents a chronic ailment of your databases.
Slowness can be attributed to multiple factors such as:
- Network problems
- Missing indexes
- Improper caching
- Un-optimized queries
- Database architecture
Reduced database performance is heavily influenced by your database’s existing structure. As DBAs, it is our primary responsibility to mitigate these effects.
Monitor Your Network and Memory
- Other nodes
- Estimate disk space and cache memory
Constantly check which applications are consuming a lot of resources. Be wary of cache memory and disk spaces as they can deplete with continuous reading and writing to your databases. Monitor your network connections to avoid any unplanned downtimes. Ensure that the allocated bandwidth is sufficient and latency for and between database servers is kept to a minimum.
Coordinate with your network team, developers, and other related departments to identify the root cause of the problem, especially if it is database performance related. Fixing slowness won’t happen overnight, but with gradual steps, the system can be tuned to its peak performance.
Review Your Database Architecture and Structure
Poorly defined and maintained databases will cause retrieval latency and performance issues. Missing indexes or unnecessary table locks are not the only contributors to undesirable database performance; database architecture also plays a significant role.
You must review your overall architecture to ensure it follows proper normalization. Duplicate data and missing primary keys are common issues in fledgling database systems. These problems are easy to shelve as backlogs, but constantly deprioritizing them will lead to cracks in your database architecture. Eventually, addressing these issues becomes labor-intensive as DBAs need to work longer hours, and costly as you plan when and how much time will be dedicated to fixing them.
For example, re-indexing tables containing millions of master records should ideally be scheduled during low-transaction periods, such as weekends. The best approach involves formulating a strategy for execution and rollback, communicating maintenance schedules to stakeholders, and ensuring the availability of DBAs during the maintenance window. Procrastination negatively impacts business when poor-quality databases persist.
Key Considerations for Database Architecture
- Does the design make sense?
- What is the probability of duplicate data per row? Is it low or high?
- When querying, will I need to access another schema to retrieve related tables?
- Are there redundant data stored in multiple fields?
- Are data types properly defined? Should I be wary of composite data types?
- Are primary and foreign keys properly defined to avoid data conflicts?
- Is the chosen indexing approach sufficient to optimize searches?
- Should I use VIEWS as a substitute for certain tables?
- How will orphaned data be handled?
- Will cache memory be automatically flushed or cleaned once data rows are deleted?
Based on your answers to these questions, you can assess the ideal state of your database architecture versus its current reality. Although database architecture falls under the authority of DevOps and Developers, DBAs are equally responsible for ensuring the databases are well-managed.
Query Plan. Plan. Plan.
Whether you are a senior DBA or a junior DBA, always remember to value your query execution plans. Utilize your EXPLAIN statements and execution plan tabs. Apply this approach across platforms, including Oracle, PostgreSQL, and others.
Double-check your database objects and queries, such as:
- Stored procedures
- Functions
- Ad hoc queries
- Connecting application queries
Ensure that their execution does not consume a disproportionate share of your database resources.
Common Query Issues
JOIN and SUBQUERY statements can be particularly troublesome. Irresponsible developers may join tables containing tens of thousands of records using ambiguous or incorrect join keys. Poorly scripted subqueries can result in slower performance and even return NULL values despite meeting conditions.
Whenever possible, use JOIN statements. They take precedence in the query execution process and limit the returned records before applying WHERE conditions. This can significantly improve query performance.
DBAs should actively search for such anomalies and work to optimize them. Fine-tuning queries is no trivial task—it may take hours to refine a single query.
Using a Tool to Make Database Management Effective and Efficient
With all the talk about optimization, management, and monitoring, DBAs have their hands full. Balancing these tasks becomes even more challenging when reduced database performance impacts your company. However, these tasks don’t have to be done manually.
A database management and monitoring solution like dbWatch can help track resource-heavy queries. dbWatch Control Center monitors critical aspects of your database, such as memory, storage space, disk space, cache memory, and temporary tables. Jobs within dbWatch provide detailed insights directly on your dashboard, ensuring you have the information you need at your fingertips.
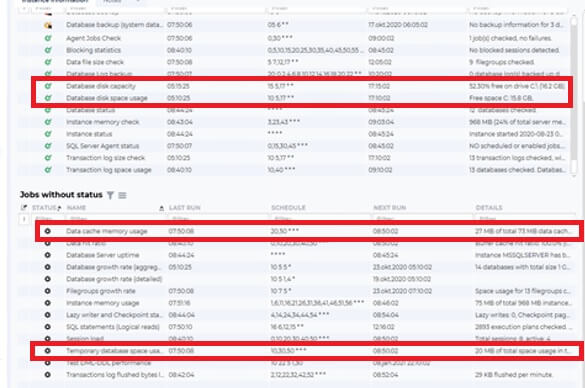
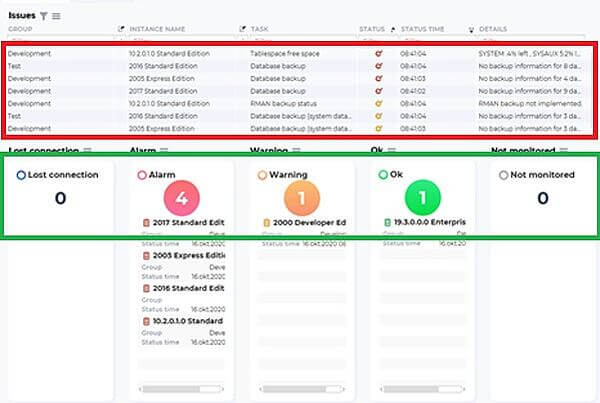
Database and server connections are also constantly checked by dbWatch Control Center. The monitoring dashboard lists all possible issues and provides detailed statistics of databases when a problem occurs. The screenshot below, highlighted in red, illustrates issues encountered during a scheduled job run. Most notably, no backup plans were established for the listed instance, categorizing them as recurring issues.
Monitoring Your Instances Constantly
The green box shows the statistics of instances. There are five categories with differing colors:
- Red: Indicates a major problem has occurred within the instance.
- Yellow: Shows that a DBA’s intervention may be needed to properly address the issue.
- Green: Highlights instances showing no signs of problems.
- Blue: Displays instances that are down.
- Gray: Points out added instances without monitoring jobs installed.
DBA in a Single Window
On the database management side, you can perform your database administration tasks in a single window. Upon accessing the management module, look at the left-side pane of the screen. Here, you will see a tree-like structure (see Red Box) where you can do the following:
- Configure your database security
- Alter indexes
- Set up backups and restore them
- Configure your SQL agent
When you register for a free trial, you can use dbWatch for three months and see if it fits to your organization.