


Database reporting software can save weeks of manual work. Instead of assembling reports by hand for every stakeholder, you define what you need once and let the software collect and present the data for you. A good solution will also offer email integrations, so reports are sent directly to the right people on a schedule.
Most reporting software comes with standardized reports that give you a solid view of your environment’s state. Other software also let you tailor reports to show more detail or create your own from scratch.
Some platforms go further and let you build fully custom reports on top of whatever you can query in your databases. dbWatch is one of those tools: it was created to remove the pain of manual reporting. In dbWatch, if you can query it, you can report on it.
This blog walks you through how to use dbWatch as database reporting software and highlights some useful reporting features that can be easily overlooked.
Before we dive into how dbWatch works, it’s worth briefly looking at why database reporting software matters in the first place.
Why Use a Database Reporting Software?
Manual reporting is a time sink. One ‘simple’ report can mean a full day of pulling data from different systems, checking uptime, backup status, health and security, then formatting everything for the stakeholder.
Database reporting software, like dbWatch Control Center uses the monitoring data it already collects to build and deliver these reports for you. Anything you track (uptime, backups, performance, security) can be turned into a clear report for management, auditors or customers.
You define the report templates once, choose the metrics, schedule, and recipients and let the software do the rest. RPDATA Solutions, a managed service provider, uses dbWatch Control Center to save up to 12 weeks of work a year.
dbWatch Control Center provides Database Reporting Software
In dbWatch Control Center, the reporting module sits on top of the monitoring engine. As monitoring jobs run, they write history and metrics for each instance into the dbWatch repository. The reports read from this repository and turn that data into structured summaries and trend views that DBAs and stakeholders can scan quickly.
Reports templates available in dbWatch Control Center include:
- Backup Reports: Ensure backups are successful and compliant.
- Uptime Reports: Monitor system availability and reliability.
- Database Health Check Reports Templates: Provide detailed insights into the overall health and performance of your database systems.
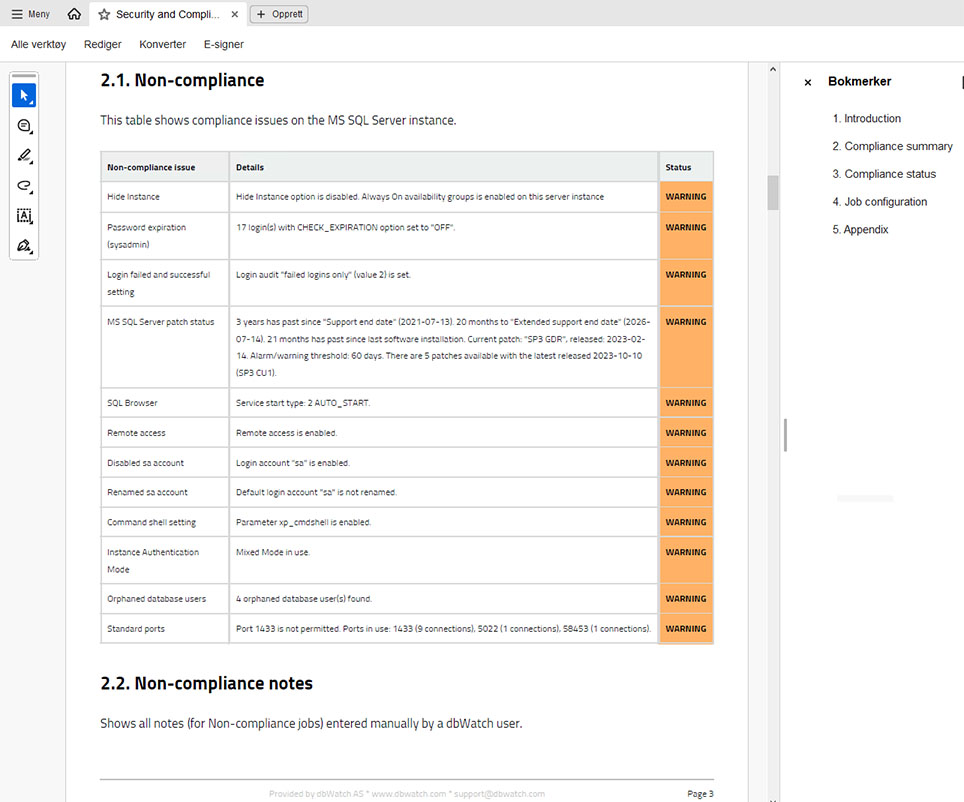
- Database Security and Compliance Reports Templates: Ensure adherence to security standards and regulatory requirements (part of the Security and Compliance Package).
These templates are fully customizable. You can copy and adapt the reports or build your own. Reporting is separate from how the data is collected, so you can also point reports at any data in your database.
Some customers use dbWatch Control Center as database reporting software for their own applications. For example, reporting on application specific table and business metrics rather than only infrastructure data.
Customizable Database Health Check Report Templates
In dbWatch, the most basic level of database report customization allows you to add branding on internal and external reports.
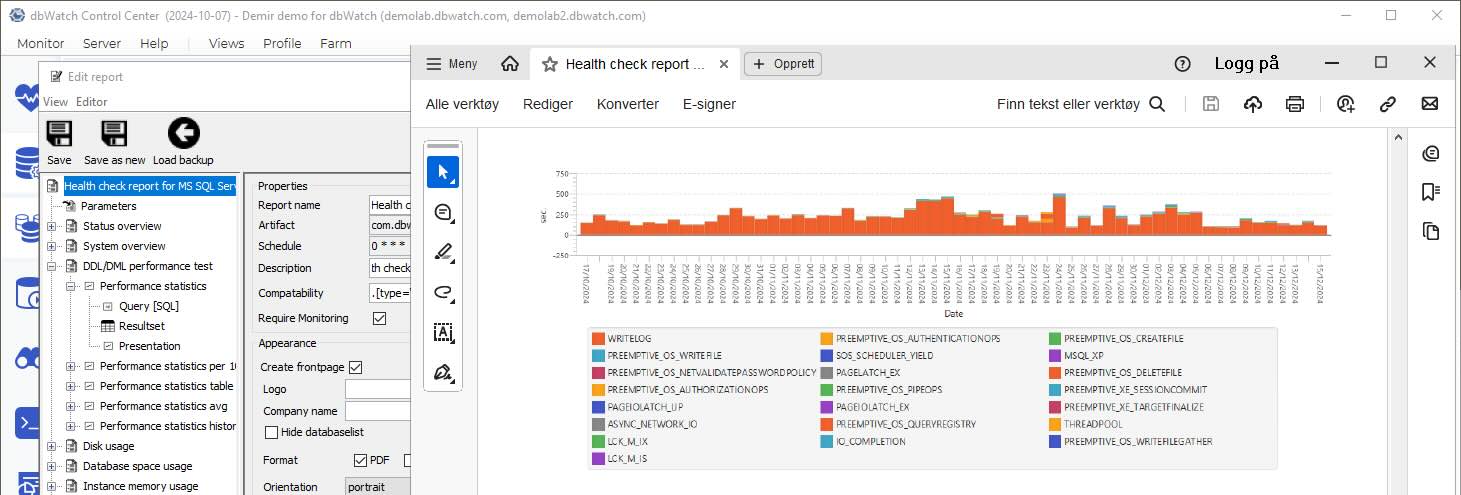
All of the built-in reports can be used as database health check templates. Open an out-of-the-box report and use the ‘save as’ function to make a new report. Then, add or subtract parameters to personalize report outputs. Starting from the existing template saves time compared to building a report from scratch.
For example, a full health check report is around 75 pages long. You can copy the report template, remove sections not relevant to you, and adjust the defaults such as the output formats and page orientation. The result is a shorter report focused on what matters to you. If someone accidentally direct edits, forgetting to use the ‘save as’ function; don’t worry; there are automated report backups, and you can restore the template from an earlier version.
dbWatch Control Center also supports fully custom reports on application-specific data. Custom reports extend reporting to all data stored in the database instances. For instance, a construction company might track submitted designs and flag missing files or unresolved issues.
Automating health check reports eliminates the need for you to manually extract and deliver data. It gives you time to focus on critical tasks while ensuring stakeholders receive timely, actionable information.
Want to see this in action? Watch our step-by-step webinar on customized reports in dbWatch Control Center.
Reporting on Cross-Platform Databases
You can run dbWatch Control Center reports on one database instance or a set of database instances. One report can include multiple database platforms. This is mainly used when you want to use one query across your entire environment. For example, we run our uptime report on multiple database types, so you’ll get uptime from your database environment, regardless of the platform.
You’ll be able to have:
- Oracle database health check reports
- SQL database health check reports
Either as separate reports or in one document.
When working with SQL and MongoDB, you’ll need to use Farm Data Language (FDL) to aggregate your data. However, some DBAs find it easier to use FDL for SQL queries. FDL gives you the benefit of getting structured data that is difficult to write in SQL. For example, when you need metadata that isn’t in the database.
For example, when joining data in SQL, it has to have a link to join it. In FDL, a link isn’t needed; you join it because it’s part of the same instance or section. So, sometimes, it is quicker and easier to write in FDL than it is in SQL.
In dbWatch Control Center, you have multiple options. You can mix and match with some sections that do FDL, and some are doing SQL statements.
Scheduled and Automated Reporting
Once you’ve customized your reports in dbWatch Control Center, you can use it as your central database reporting software by scheduling those reports for automatic delivery. You’ll be walked through the process with prompts like ‘report now’ or ‘set a schedule.’ Choose when to run the database reports and pick which recipients will receive the report via email. For example, you can set the system to give health check reports every Monday morning.
Once a report is scheduled, you can view and manage all scheduled reports on the server and you can run a report out of schedule as well.
Use Case: Database Health Check Reports
Health check reports provide a comprehensive overview of the current and historical state of the databases. Graphs and other visual data points make identifying and interpreting performance patterns easier. In many cases, database health check reports help you pinpoint system issues remotely and even diagnose underlying problems without on-site intervention.
Managed Service Providers (MSPs)
Health check reports are a key tool for client communication and monitoring. Scheduled weekly or monthly reports give MSPs the ability to track database performance over time and detect anomalies by comparing recent data with historical performance benchmarks. This supports transparency and accountability in customer relationships.
Many MSP customers create their own variants of the standard database health check reports. They start with the built-in template, add their branding, and the metrics they need. Tailored reports are helpful in monthly customer meetings.
In-house IT Teams and DBAs
Regular review of database health check reports helps organizations identify potential risks before they become serious. Health check reports also maintain detailed historical records, invaluable when there’s an issue or you need to understand past configurations.
With automation of routine checks and diagnostics, the reports reduce manual monitoring efforts. Technical teams can spend more time on strategic work, while the business benefits from consistent optimized database performance and actionable insights delivered to stakeholders.
Using dbWatch Control Center as Database Reporting Software
dbWatch Control Center helps DBAs gather, analyze, and deliver database data. As a database reporting software, it provides standardized reports and let you customize them to match your organization’s specific needs.
You can automate recurring tasks, which reduces manual work and supports better decision-making with consistent accurate insights. The reporting features are useful for monitoring, troubleshooting, and managing business data efficiently.