


How long does it take to get started with dbWatch?
It depends. But to give you a solid idea: in a recent webinar, we started with a blank Windows server and configured about 40 databases in a small environment. The webinar lasted 45 minutes. However, we devoted some of that time to demonstrating the product once the instances were added.
In this blog, you’ll get a quick overview of how the setup works from beginning to end with links to step-by-step guides to help you through the process.
Getting Started with the Installer
The first step is simple: sign up through the dbWatch portal, where you can download both the software and your license. From there, the Setup Wizard takes you through the installation. Most DBAs use the default settings, including the default port and work area.
In your dbWatch Portal account, you’ll find educational videos, or you can use the dbWatch Wiki to help you get started.
With installation complete, the focus shifts to configuring your environment.
Making the Initial Configuration
When you open dbWatch Monitor for the first time, you are guided through the first configuration steps.
You’ll first need to add a domain. You’ll also decide if client and server share a machine. (Then use the localhost and the default port.) Or if they don’t. (Then use the host’s address.)

Configuring the server
The wizard guides you through the configuration process. The only tricky part is the two choices for the server role. Make sure to select ‘Set as a domain controller.’ You’ll also add the license file and make your username and password in this step.
Once you click Apply, dbWatch completes the server setup in the background. That includes creating the admin user, enabling the license, and generating certificates. The system may look idle for a short while, but it is still working. Soon, you’ll be connected and ready to start adding database instances.

Adding your first instances
Click the plus icon to open the wizard, which guides you through each step. The process is similar across platforms, making it quick and repeatable.
If using a non-standard port, some fields may not auto-populate. In that case, select the database type manually. You can also add different authentication methods. More advanced options like OS authentication and Kerberos are in the wiki.
In the wizard, choose the instance’s group. dbWatch defaults to development, production, and test groups, which you can rename and reorganize. Select the local dbWatch schema for complete monitoring, since it stores the required history and data. (See photo below.)

We recommend starting with the default template rather than customizing everything up front. You can select custom jobs at installation, but our best practice is to set the defaults first and adjust later.
You then define the users for each module, set their display names and any notes, and click Install. That is enough to get the instance into dbWatch and begin populating monitoring.
Note: You can also use Auto Discovery and bulk add to add databases.
Out-of-the-box Value Starts with Monitoring
When you select a newly added instance, you may see installed monitoring jobs that have not yet run. That is by design. The jobs run according to schedule so that dbWatch does not create unnecessary load, especially when many systems are added at once. If you want to trigger them immediately, you can right-click and choose ‘Run now.’
If you right-click an instance and choose ‘Configure jobs,’ you can see both the jobs that are already installed and many more that are available. This is where the out-of-the-box message becomes especially clear. The default template includes many monitoring jobs that are useful for almost all systems and are part of our best practice setup.
That does not mean everything is installed by default. Security and compliance jobs, and most maintenance jobs, are not typically installed during this initial setup because users may not be ready for them or may already have other maintenance routines in place.
You’re not starting from scratch. Begin with the default set, then adjust as you learn about your environment.
Working with Templates and Parameters
One detail worth understanding early is how templates behave.
When you install a template, it automatically installs set jobs. You can remove individual jobs at any time. However, when you remove a job from an active template, the template will auto-install them again when it has a daily check.
Should you wish to customize, you have several options: deselect the template, which is fine for smaller set-ups, or copy a template you like and then adjust the template, which is better for larger set-ups.
Some jobs may trigger warnings or alarms based on the default settings. That is why it makes sense to review your systems and adjust parameters where needed. If there are thresholds or settings that do not fit your environment, you can right-click the instance and configure them to better match your own standards.
Adding Email Integration
Once the basics are in place, the next step is often email alerting.
A word of advice: go through your instances first and make sure you are not looking at a sea of warnings before you enable email alerts. Otherwise, you may simply fill your inbox with alarms before you have had a chance to tune the system.
To enable email, go to ‘Server Extensions’ and configure the email extension. Office 365 setup is covered separately in the wiki, as are standard email and SMS gateway options.
Here are a few useful settings:
- The subject prefix helps with filtering.
- The reminder interval controls how often you will be reminded about an issue.
- The rule configuration lets you decide which systems, alarm types, recipients, and schedules apply.
In the example shown below, alerts are limited to production systems during office hours, but the filtering can go much further, including metadata and specific job names.
This reflects dbWatch’s overall approach: start practical and refine based on your team’s workflow.
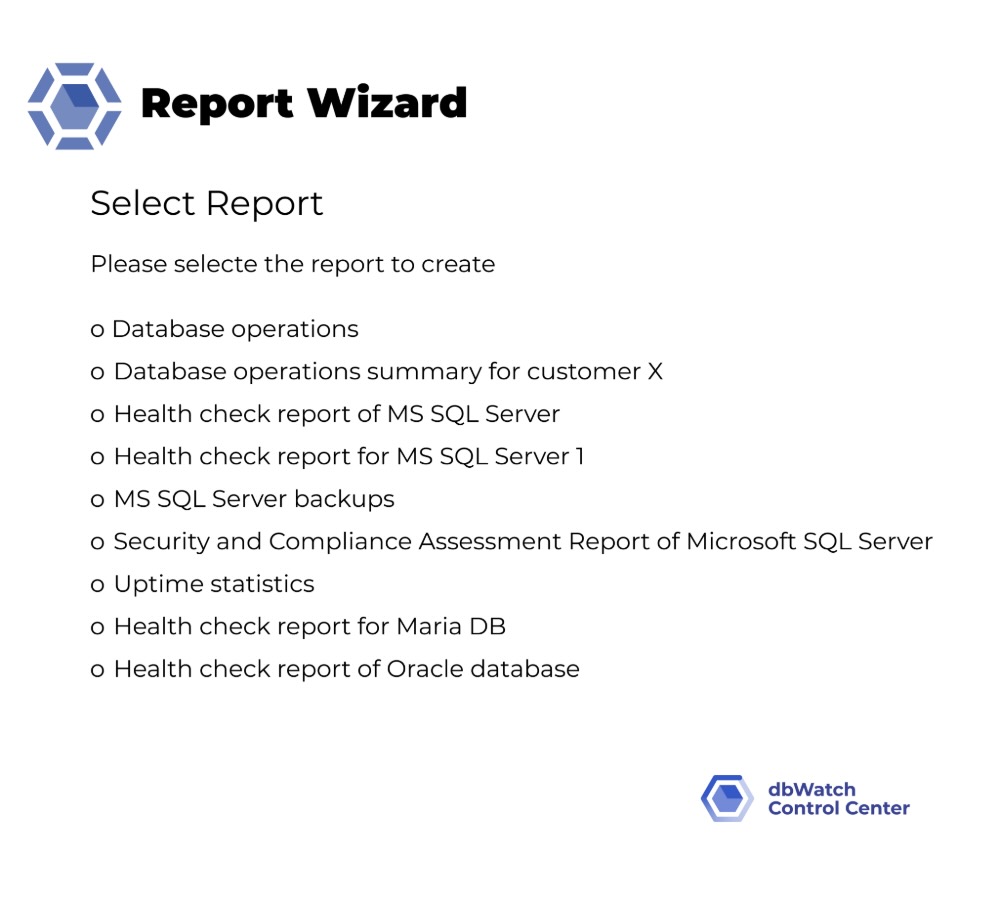
Reports and scheduled output
Reporting is one of the out-of-the-box capabilities available once systems are in place. You can select an instance, see which reports are available, and generate something like a health check report immediately. You can also create a schedule, so the report is delivered regularly, for example, every Friday afternoon.
Just know you’ll need to wait about a week for reports with important information because a new system has very little historical data, yet. Over time, you can go further: edit report templates and customize outputs, so you get the exact information you need.
A Practical Way to Get Started
By following dbWatch best practices, you can start with the standard defaults and adjust as needed. It’s always possible to change and adjust your systems over time. If you’d like to see a small setup installed live, the Get Started For Smaller Setups webinar is worth watching.
Want to discuss how dbWatch would fit your own environment? You can also book a demo and walk through the product in more detail.