


If you find yourself developing applications focused more towards the web or even mobile applications, sometimes you might inevitably run a few SQL queries – you need to interact with your database systems anyway, don’t you?
Don’t fret – all database users run SQL queries. It’s important to run them in a proper medium. However – while most, say, MySQL database administrators, run their queries inside phpMyAdmin, some database administrators might find themselves searching for different alternatives.
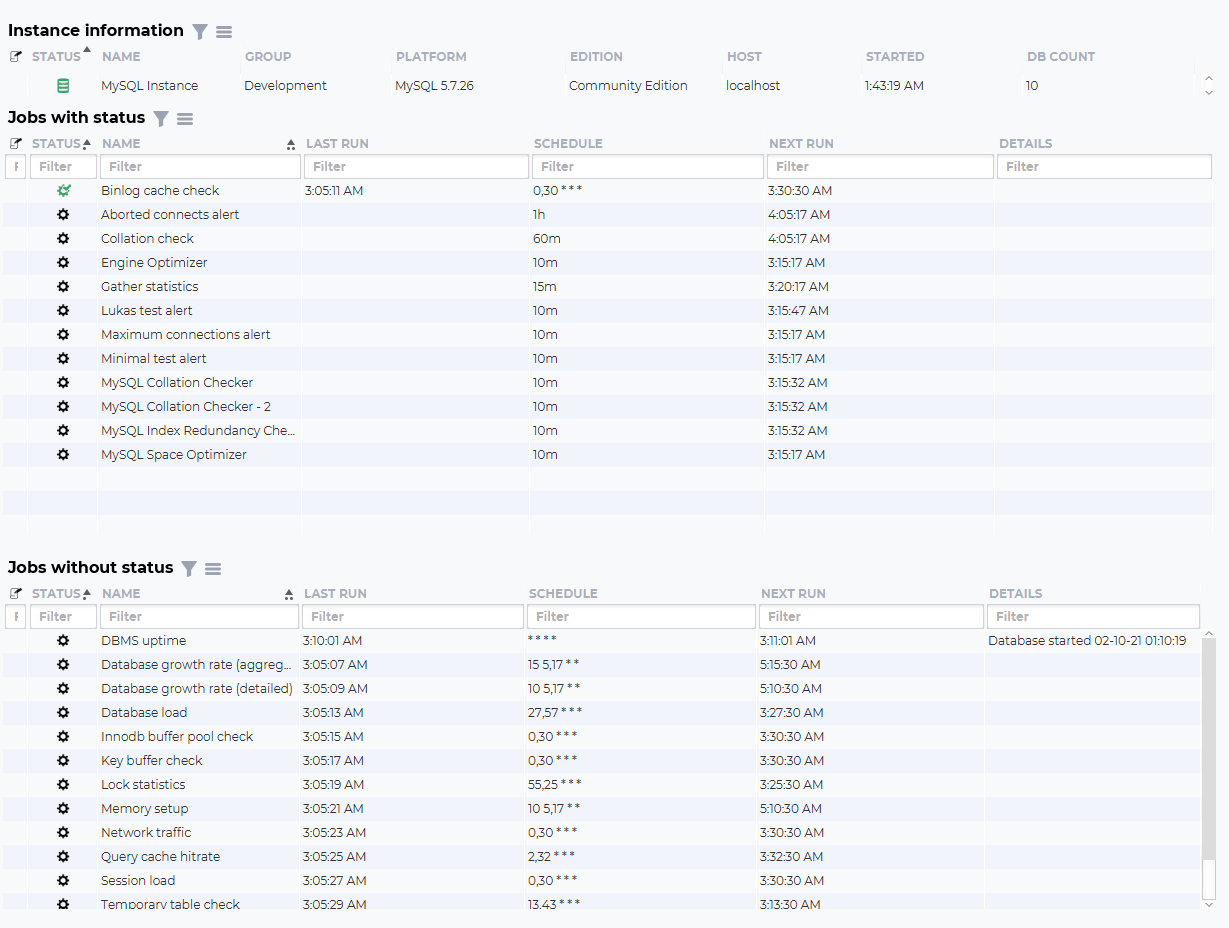
Indeed, there a quite a couple – if you find yourself deeply immersed inside of the database management world, you might have already noticed that you can run your SQL queries together with some database management tools. Most database management tools that allow you to run SQL queries inside of your database instances also allow you to do a couple of different things – for example, run a couple of database jobs that let you observe the full power of your database instances or let you see the amount of logical reads (writes) going on in your database instance:
Today we are going to be focusing on another one for this blog – we are going to be telling you why it’s important to get assistance while running SQL queries inside of your database instance together with tools like the one provided by dbWatch.
Running SQL Queries with dbWatch Control Center
You see, while dbWatch isn’t a SQL client, it does have the ability to help you craft your SQL queries – simply observe the left-hand side of dbWatch and choose the fourth option from the top:

Once you’re done, make sure dbWatch is connected to the database instance you want to run queries on – click on the Reload Auths button:

Once the authentication is reloaded, you should be able to see the username next to your database instance:

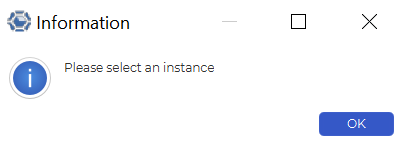
Tick the checkbox next to your database instance, and you should be more than ready to run queries inside of a given database instance (do note that if you do not, dbWatch will provide you with an error):
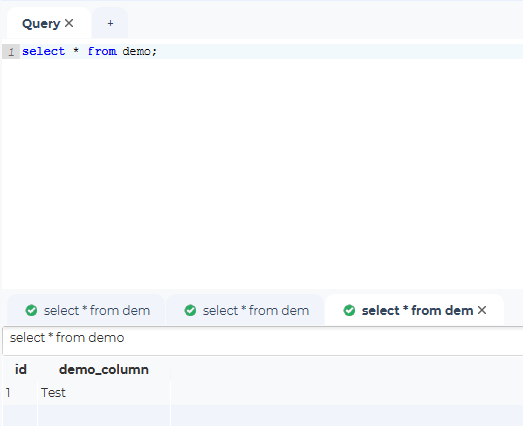
Now it’s time to write your queries that interact with your database instance – for that, dbWatch will provide you with a very nice user interface and, underneath – the ability to see the results of a given database query – input your query inside of the SQL field, and click “Execute” if you want to run it – if not, you can also clear all of the input, output (also save them.)
While your query is running, you will be able to see the amount of time your database query is running – if you don’t see any results, but keep seeing that the query continues executing (see example below), you might want to add a couple of partitions or indexes on top of your table – that should fix the issue:

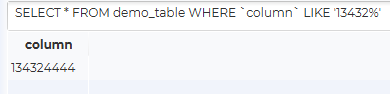
If your query ran successfully, you will be able to observe the output (in this case, our column is called “column”, so we needed to escape it with backticks (note the `column` inside of the query)):
See underneath the SQL window displayed by dbWatch – you will be able to observe what queries failed to run and what queries ran successfully:
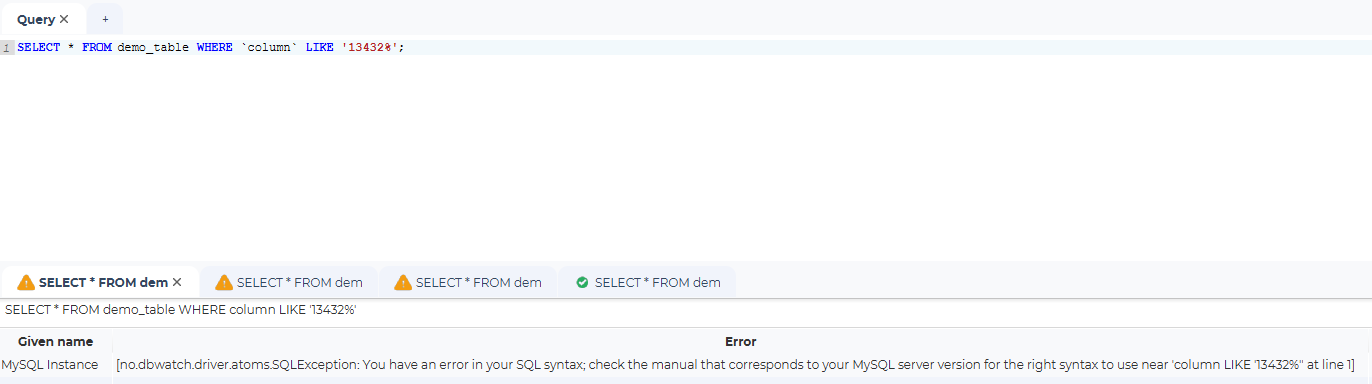
See the “!” in the triangle-shaped box? Those queries failed. See the tick next to the last query in the list? That query ran successfully!
The ability to simply run queries is not everything that dbWatch comes with though – as already noted, you will also be able to “load input” to run (e.g. import SQL files that contain SQL queries for dbWatch to run), clear input (the SQL queries you just ran) or output (the results of the SQL queries), if you want, you will be able to save them as well. For example, click “Clear Input” and you will be able to see that your SQL queries disappeared:
See? Easy as that! No more deletion – who needs that? dbWatch will delete all of the things for you.
Output Panels
In case you didn’t know that, dbWatch will also provide you with one output panel per every result set returned. Here’s how that looks like:
Summary
It doesn’t matter whether you are a high-end developer that deals with databases on-and-off or a full-fledged DBA of Oracle, MySQL, MariaDB, or even Sybase – you will need to be running queries focused at a specific database instance sooner or later. dbWatch comes with a SQL query feature – underneath the query you will be able to observe the results of it. You will also be able to see how many queries of yours have run successfully and how many failed – do so and your database instances should be headed towards a more performant future!
If you find yourself running into any kinds of issues when using the tool, keep in mind that dbWatch has a support team consisting of top-notch database administrators – they can solve all of the problems you face within no time, so don’t be afraid to reach out and you will receive the help you need very quickly. We hope you enjoyed reading this blog and will stick around – we have a lot more content coming up.