


SQL Server blocking or queries creating blocks is just another performance aspect headache for DBAs. However, where there are databases, there are blocks. It’s just a matter of how many, when they hit, and how quickly you can identify their source and fix the problem.
Recently our customers asked us to improve our SQL Blocking views. Now they have access to logarithmic graphics and multi-layered drill downs into the history of the SQL Server blocking events.
In this blog, we’ll give an overview of the features and how you can use them to resolve your Blocking in SQL Server.
For those of you looking for information about how blocking creates locks, check out our blog on database locking.
Check Blocking in SQL Server
First, make sure that you install the ‘Blocking event collector’ job. As soon as it’s installed it starts collecting all blocking events. Note, this is aviable for all customers who have purchased the SQL Performance Package and for those on a free trial. It is possible for current customers to have a trial of the package, simply contact us.
Now that it’s installed and you already have a basic understanding of how to use the package, a word about the default settings.
Time Range
When you enter the first time, you’ll see a time range of 24 hours. The program will remember your time range. If move elsewhere in the management area and come back, you will return to the view and time range you had.
Frequency of checking blocking in SQL Server
The default frequency of checks is 10 seconds. For some of you, this might be too low. For example, some DBAs have blocking events that resolve in under 15 seconds. In order to get a better overview, they set the collection period to trigger every 20 seconds.
Collection period for SQL Blocks
Many DBAs find that the default history of two weeks offers plenty of time. However, you can easily adjust to less time. Having a longer history is possible; the two-week cutoff is set so not to waste unnecessary space.
How to Check Blocking in SQL Server, Using Drill Down
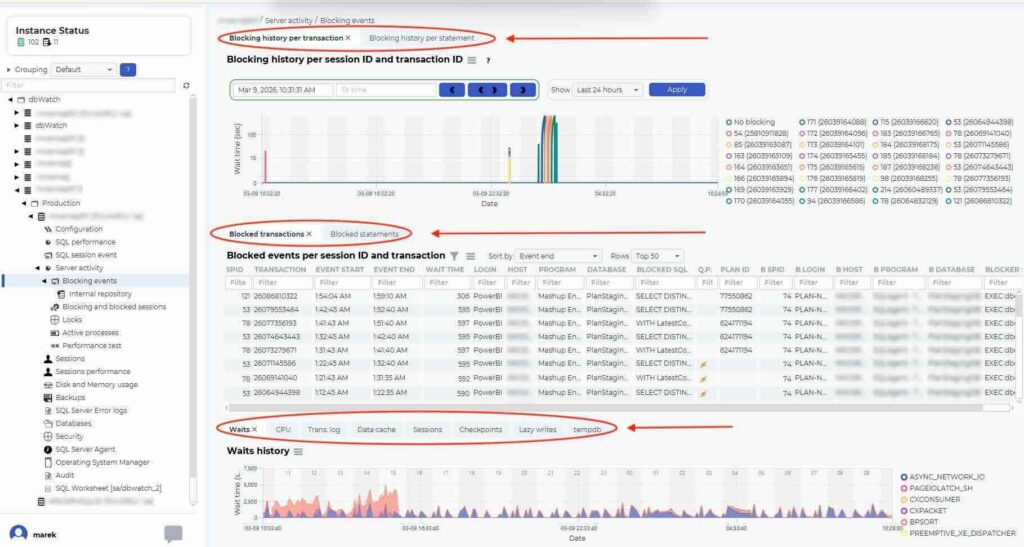
To reach the blocking information, enter the management module, select ‘Server Activity’ and then ‘Blocking Events’.
Image 1: Where to find blocking events in dbWatch
Click in an instance and now you have an overview. See Image 2. You have several tabs here that allow you to adjust your views. At the top, blocking history can be viewed per transaction (as below) or per statement. At the bottom of the screen you eight tabs show information like: waits, CPU, trans log, data cache, sessions, checkpoints, lazy writes and tempdb.
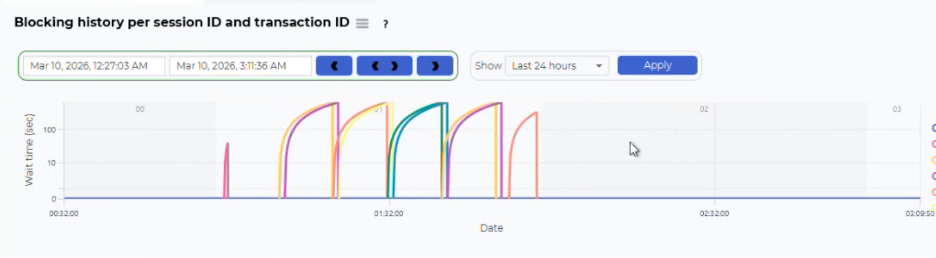
With all of these graphs, you can adjust your time window. You can show a set number of hours. (Image 3) or highlight a specific area by dragging your mouse. (Image 4).


Either way, it narrows your time and you’ll get something like Image 5, below. Note the time stamps on the left show the exact time period.
Note the curves of the graph due to the logarithmic scale. That’s explained in the next section.
The Graphs: Visualizing SQL Server Blocking
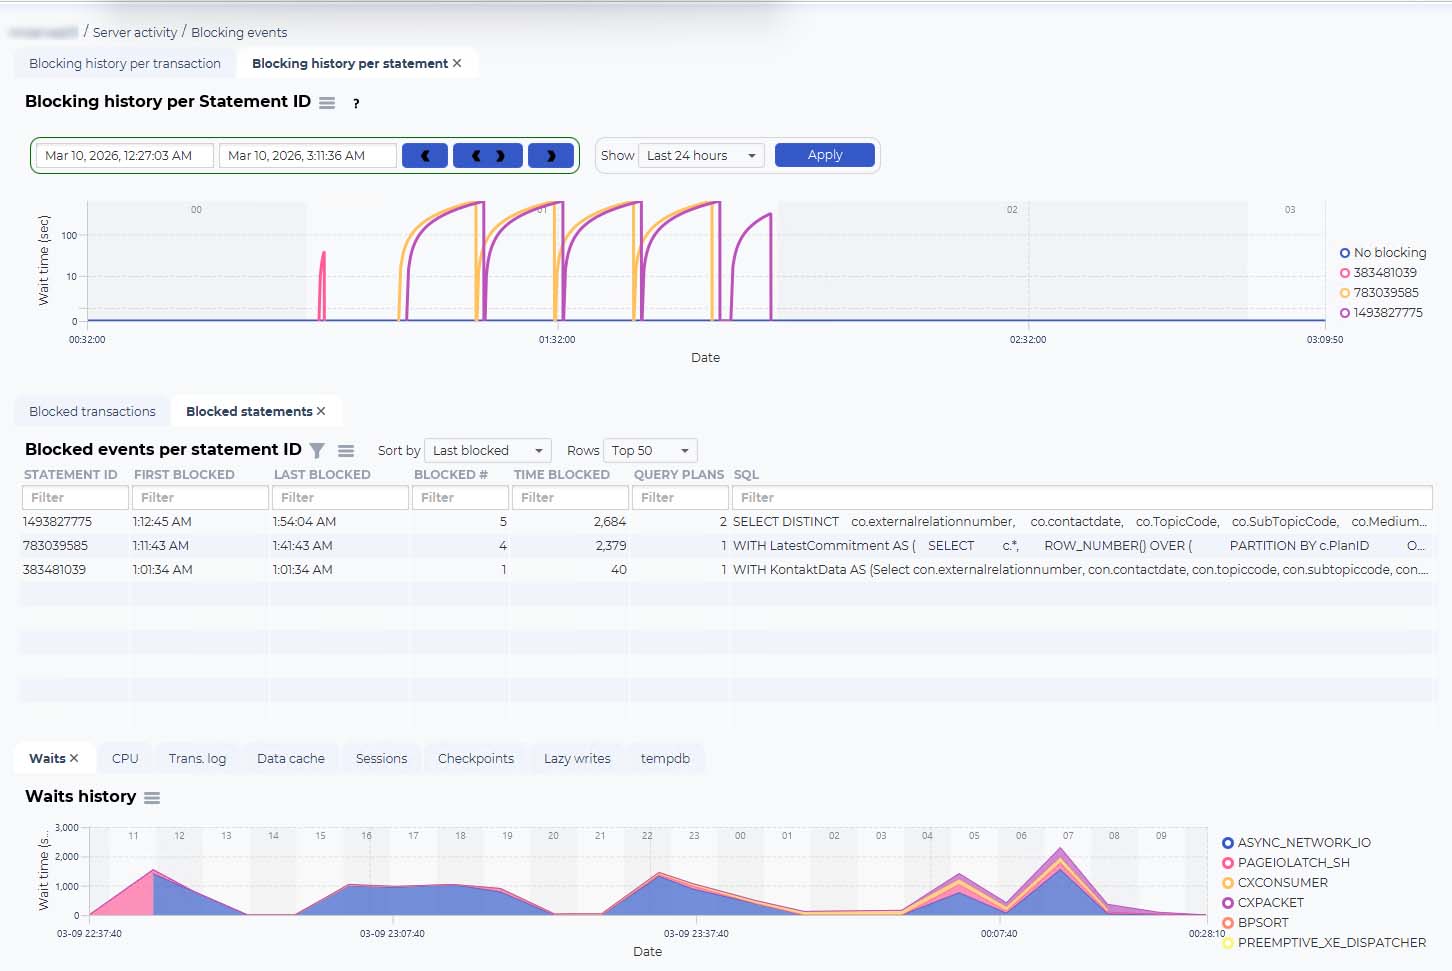
The graph shows a visual of how the transactions have been blocked over time. The X-axis shows time while Y-axis indicates the duration of the block using a logarithmic scale.
Each blocked session will look like a curved line. As the blocking duration increases, the curve becomes more horizontal, due to the logarithmic scale on the Y-axis. Why? Because having a logarithmic scale allows you to see short blockings and long-running blocking events clearly without the longer running blockings dominating the visualization. The scale gives you a compact view of the blocking behavior, so you can easily identify patterns, outliers, and long-running blocking events.
Using the SQL Server Blocked Views to Diagnose Issues
The Blocking Overview provides a high-level snapshot of what’s being blocked, how long it’s blocked, where it’s happening, and when. This is your default starting point—ideal for quickly identifying active blocking issues.
For deeper analysis, the Blocking History per Transaction and Blocking History per Statement views let you drill down into individual issues. Here, you can spot patterns, such as the same statement repeatedly causing blocks across different transactions. For example, you might observe a single statement that blocks, finishes, and then blocks again—possibly due to an application retrying a failed operation or a user repeatedly refreshing a query. The visual distinction between transactions (e.g., different colors) helps you track these patterns.
While you may not always resolve the issue directly from these views, they provide actionable insights. For instance, if you notice a recurring pattern—such as a statement blocking, canceling, and restarting—you can escalate this to developers with clear evidence: “This statement is causing repeated blocks. It might be due to an application retrying after timeouts or a user manually refreshing a query.” Expanding the time range (e.g., 48 hours or more) can reveal whether the issue occurs at specific times, helping you identify trends or scheduled processes contributing to the problem.
These tools show what is blocking and help you understand why and when, the blocks happen, enabling more informed troubleshooting and collaboration with development teams.
Below you can see the blocking history per statement, Image 6. (Blocking history per transaction was in Image 2 above.)
Drill Down into SQL Server Blocks
There are also views with tables and graphs that give you in-depth information. Below you can see how to look into a single transaction from the Blocking history per transaction view. A right click displays a menu with five options.

SQL Server Blocking history
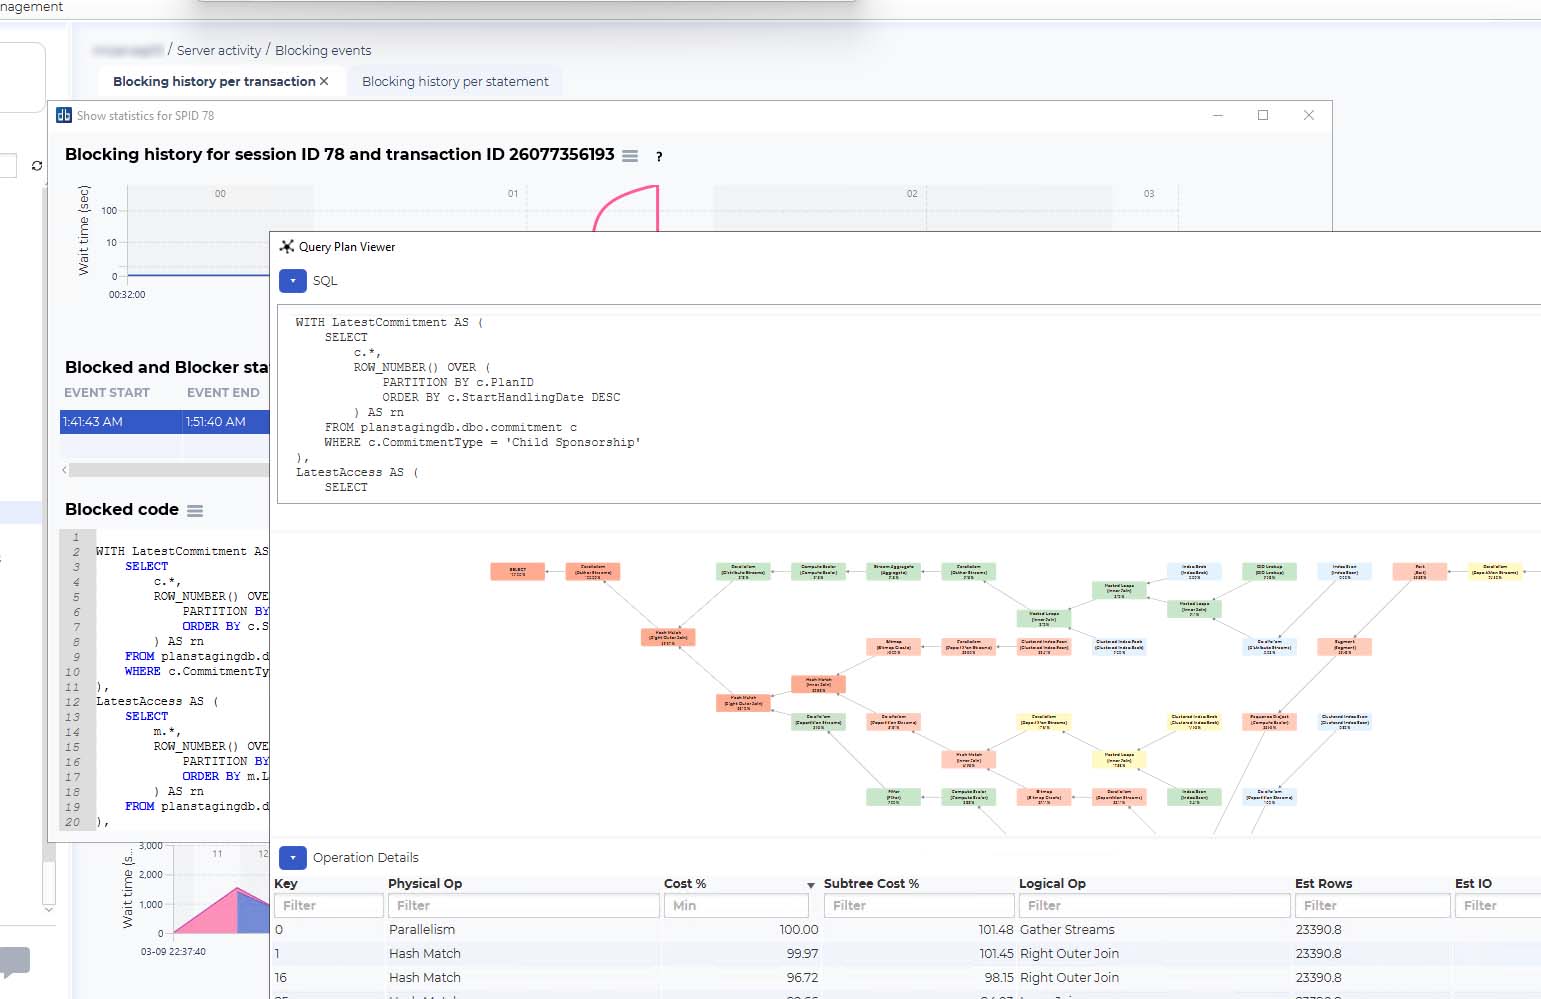
Below is the blocking history for an individual event.

It’s also possible to map a query plan (below). A query plan visualizes how the database executes a query by breaking down each step involved in retrieving and processing data.
It’s color-coded for performance, with red indicating higher resource consuming areas and green or blue indicating less consumption. This tool helps identify where time and resources are consumed. By analyzing the query plan, you can pinpoint the root cause of performance issues and potential blocking points. For instance, a full table scan, could highlight the absence of an efficient index and/or performance bottlenecks. This insight allows you to optimize query performance and mitigate blocking issues effectively.
Getting an Environment-wide Overview of Blocking

Understanding and resolving SQL Server blocking issues is crucial for maintaining optimal database performance. With our enhanced SQL Blocking views, you can gain deep insights into blocking events, identify patterns, and collaborate effectively with developers to address performance bottlenecks.
By using tools like query plans, you can pinpoint and resolve issues more efficiently than ever before. To see these features in action and learn how they can benefit your organization, book a demo with us today and take the first step toward smoother, more efficient database management.