

Currently, many organizations are looking for SolarWinds alternatives to improve database monitoring and management. Some maybe evaluating alternatives due to costs, other’s may have scaling issues or other challenges. The five Solarwinds alternatives reviewed here all are good and each have areas where they excel.
For each tool, you’ll get an overview of how it supports database administrators (DBAs) in their daily work.
If you’d like to get straight to the point, just click on the alternative you’d like to find out more about:
The evaluation criteria
This comparison reflects publicly available information as of October 2025. Products change frequently, if you spot an inaccuracy, please let us know and we will correct it.
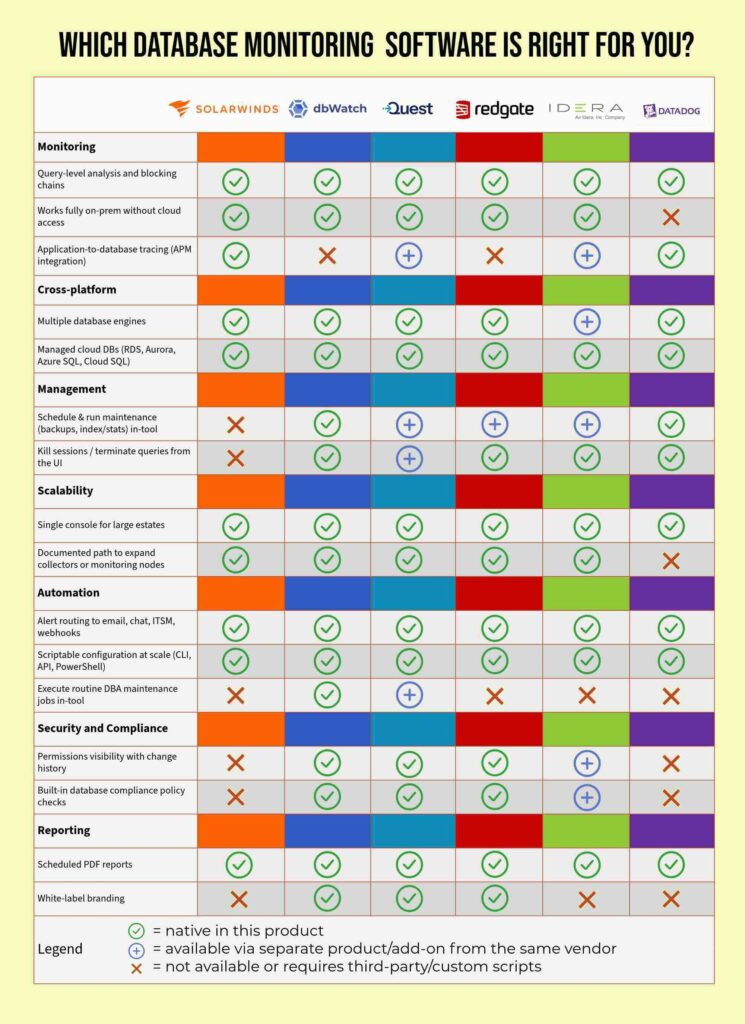
For each alternative tool we’re looking at the six factors listed below. At the end of the article, you’ll find a table to use as a quick guide.
1. Database Monitoring
Monitoring from a single console eliminates repeated sign ins across instances, detects issues before users feel them, and proves history to help you spot patterns. Remember to look at cross-platform compatibilities. The best monitoring tools, work regardless of your environment fragmentation.
2. Database Management
Managing from a single console reduces repeated sign ins, makes changes consistent, and speeds remediation when issues appear. Look for cross-platform administration with bulk actions, role based access, guardrails like previews and approvals, and the ability to run common maintenance on demand.
3. Database Scalability
Growth is constant. Tools should let you deploy and immediately monitor thousands of databases quickly. Make sure to check both technical scalability and pricing so costs remain predictable as you expand.
4. Task Automation
Automations handle routine checks and responses the same way every time. This reduces the DBA workload and shortens time to resolve.
5. Database Security and Compliance
Security and compliance features help you control who can see what, prove that controls are working, and collect evidence for audits. Even if your team is not regulated today, these basics protect the estate.
6. Database Reporting
Reporting turns metrics into decisions. Scheduled reports and shareable dashboards keep operations, management, and auditors aligned without extra manual work.
These six factors are key when comparing SolarWinds alternatives so you can determine which best supports your environment.
SolarWinds Today
Before diving into the alternatives to SolarWinds, here’s a quick reminder of what the platform offers today.
SolarWinds gives database teams three main paths:
Database Performance Analyzer (DPA) and SQL Sentry
These are query-centric tools with drill-downs for waits, blocking and deadlocks, plus historical context and annotations.
SolarWinds Observability
Observability monitors self-hosted and managed databases supporting MongoDB, MySQL, PostgreSQL, Redis, and SQL Server.

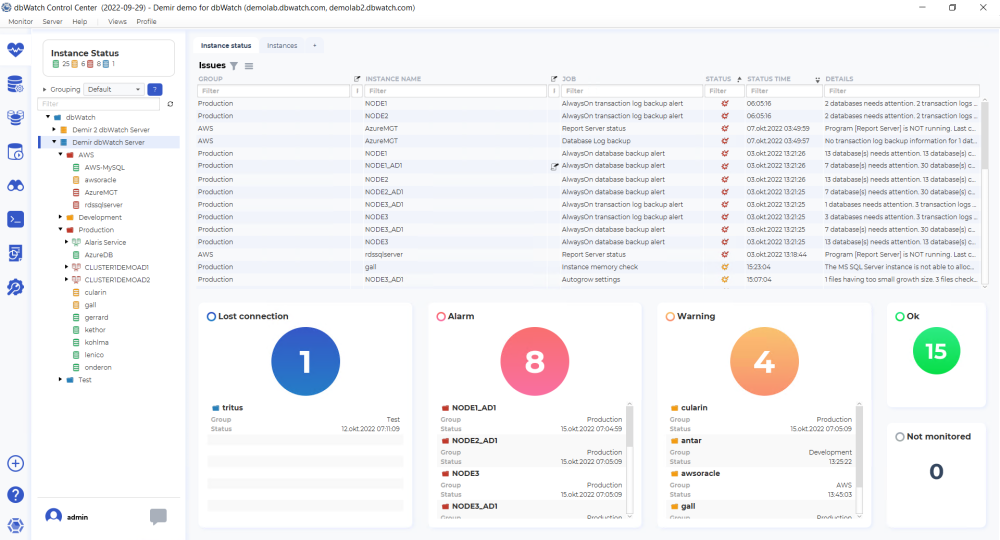
1 dbWatch Control Center
dbWatch Control Center stands out among SolarWinds alternatives due to its scalability and broad cross-platform coverage. It provides database monitoring and management across any location and many platforms, giving DBAs one console for daily work.
The add-on packages offer capabilities like deeper performance analysis and security and compliance for policy checks, access control, and audit-friendly reporting. The Cloud Router add-on provides secure, governed access to environments without opening broad network paths.
The software is installed on-premises. For cloud-only environments, dbWatch can be put in the cloud with a Linux or Windows machine hosted in the cloud.
Best for teams with mixed environments that want one console for monitoring and hands on management. It scales well, with the possibility for custom jobs. For very large environments, Farm View dashboards provide full views of single metrics. Multi-site organizations and managed service providers can get secure remote access through the Cloud Router add-on.
Free trial for 90-days
Pricing is clear on the website, with a pricing calculator showing the complete environment costs.
Monitoring
Centralized monitoring across many platforms (listed below) offering health dashboards, alerts, and estate views. Group and filter by tags, sites, or farms to find issues quickly, then drill into instances and databases for details. Add custom monitoring jobs to track business specific conditions alongside standard checks.
Cross-platform
Designed for environments that span on-prem and cloud. Supports Oracle, Microsoft SQL Server, PostgreSQL MySQL, MariaDB, MongoDB, and Sybase ASE. Cloud platforms include: Microsoft Azure, Amazon RDS, and Amazon EC2.
Control Center has a single console and helps provide consistent workflows, so teams do not need separate tools per platform.
Performance metrics
The SQL Performance Package provides diagnostics for query behavior and resource use. You can review past performance, find queries behind waits or blocking, track users and see which queries they’ve run and enable tracing of access to databases. It’s also possible to drill down into historic data.
Automated Maintenance
dbWatch also offers an automated maintenance package. Found in the monitoring console, it includes a maintenance library that supports DBAs by making their jobs more automated. It includes jobs like: backups and routine tasks.
Management
In dbWatch DBAs can switch between finding the issue in monitoring view to fixing it in management view. It offers a place for managing all the daily DBA tasks.
It also can be very useful for cross-platform management: when and Oracle DBA is off work, a DBA who knows MS SQL Server can step in and manage their databases.
Scalability
Built for large environments with ten thousand or more instances, dbWatch offers multi-site filtering, and workflows for repetitive tasks. Dashboards include ‘farm views,’ which give insight into how one metric behaves across the whole environment.
Compliance
The Security and Compliance package helps teams align with internal policies and external standards. It helps your databases reach and keep compliance standards such as ISO and SOC.
Reporting
Built-in and customizable reports for the whole environment, instances, and workflows. Schedule distributions and use filters to produce reader-friendly summaries for operations and management. Dashboards can be shared so stakeholders see the same view of health and trends.

2. Quest Foglight
Quest Foglight is a strong option for teams evaluating alternatives to SolarWinds, particularly those needing enterprise-level observability. The platform delivers database and hybrid-infrastructure monitoring, with Foglight for Databases covering on-premises environments.
For cloud deployments, Foglight Cloud provides monitoring as a managed SaaS service, while Foglight Evolve focuses on proactive performance management, resource optimization, and cloud cost modeling.
In August 2025 they launched a new capability: Query Explorer. This allows for easy searching, filtering, and analyzing SQL queries within the monitored environments.
Best for teams managing diverse database environments. They use Foglight to get a unified view across database platforms, find root causes for any anomalies, and uncover query-level insights that optimize performance, reduce risk, and prevent downtime.
Free trial: Foglight for Databases offers a 30-day free trial; there’s also a hosted Foglight Cloud Virtual Lab to try preconfigured environments.
Pricing: For on prem, they offer licenses by term or subscription. Cloud purchases are based on the quantity of databases being monitored.
Monitoring
Foglight for Databases provides a single web console with real-time and historical views, baselines, and performance investigation. It ships with out-of-the-box deployment, alert management, and templates that allow for threshold adjustments, and also includes AI Alarms for AI-assisted alert remediation. Coverage extends across both on-premises and cloud deployments.
Cross-platform
Current supported targets include Oracle, SQL Server, MySQL, PostgreSQL, DB2, SAP ASE, SAP Hana, MongoDB (incl. Atlas), MariaDB, Cassandra, Redis, Percona and cloud databases such as Amazon RDS/Redshift/Aurora, Azure SQL DB/Managed Instance, Google AlloyDB, and Snowflake. All these platforms are monitored from one console across on-prem and cloud.
Performance & diagnostics
Query Insights ranks high-impact statements across the environment and links to Performance Investigator for deeper analysis. Performance Investigator provides detailed query level analytics for Oracle, SQL Server, PostgreSQL, MySQL, and Azure SQL Database.
Observe by use, host, database and statement. You can focus analysis on a resource such as IO or locking to filter the view and then drill down into the insights. To support the analysis, there’s a long-term PI repository, two years on-prem and one year for the cloud.
Key capabilities include wait/event analysis, platform-specific drilldowns, change tracking, and comparison reporting. SQL workload tools (e.g., Query Insights) help pinpoint costly statements; historical lock analysis supports concurrency troubleshooting.
Management
Foglight is primarily observability, not a backup/DDL/change tool. That said, it provides alarm templates and Actions (email, command, script) you can bind to rules, plus a REST API and ServiceNow integration for ticketing/closures, meaning you can trigger external automation when conditions are met.
Other Quest Software offers management options. Toad Products offer database management automation options, Quest erwin Data Management Platform provides Data Modeling, Data Cataloging, Data Lineage, Data Observability, and Data Quality capabilities. Light Speed for SQL Server provides backups.
Scalability
Foglight scales via federation; HA supported. Depending on vendor set-up 10,000 + databases are supported. The Foglight team says the architecture has no hard-coded scalability limit. The software supports high availability – vendor managed in the cloud, self-managed if hosted.
Automated Maintenance
Foglight focuses on monitoring and diagnostics with alerting, templates, and ITSM/webhook integrations; it can trigger external runbooks but does not execute routine DBA maintenance natively. Comparable ‘automated management’ capabilities in the Quest stack are provided by separate tools (e.g., LiteSpeed, Toad).
In the Foglight Cloud option, the maintenance is provided.
Compliance
Foglight supports compliance-related work by maintaining an audit log of administrative changes, and enforcing access controls with role-based permissions and SAML SSO. Deployments can also be run in FIPS-compliant mode, and alarms can integrate with ServiceNow to provide traceable evidence of incident response.
While Foglight helps with data handling and auditing, it is not a dedicated compliance enforcement tool. For SQL Server environments that require detailed activity auditing and compliance reporting, Quest’s Change Auditor for SQL Server is often used alongside Foglight.
Reporting
Foglight’s reporting centers on dashboards and report templates: you can build custom report templates (often by cloning a dashboard view), run/schedule them, and share the output with others; these capabilities exist in Foglight Cloud and on-prem editions.
White-label branding isn’t provided as a turnkey feature, but on-prem customers can design their own reports and include their logo; in Foglight Cloud you can clone built-in reports/dashboards and adjust them within the platform’s safety constraints.

3. Redgate
Redgate offers an end-to-end database DevOps portfolio with SQL Server tools such as SQL Compare, SQL Monitor, and SQL Toolbelt. The platform has been expanding into broader database coverage with Flyway for migrations and cross-database change management.
Redgate also provides free tools such as SQL Search and Flyway Community, giving teams lightweight options alongside enterprise subscriptions.
Best for teams that want a SQL Server-centric DevOps toolchain, but with growing support for PostgreSQL, MySQL, and Oracle through Flyway and other newer Redgate offerings.
Free trial: Most products include a 14-day free trial; some free community editions are also available.
Pricing: Annual subscriptions per user, with tiered pricing for small teams and custom quotes required for larger deployments.
Monitoring
Redgate Monitor provides a single web console with performance and activity monitoring, alerting, and diagnostic drilldowns (e.g., waits, blocking chains, deadlocks, top queries, plan-level details). You can also mark deployments and other events on the timeline (via built-in annotations or API/PowerShell) to correlate changes with behavior.
Cross-platform
Redgate call this hybrid monitoring for hybrid estates. Redgate Monitor supports SQL Server and PostgreSQL broadly, and (as of 2025) has added support for Oracle, MySQL, and MongoDB. Monitoring spans on-prem and cloud (e.g., Azure SQL, Azure Managed Instance, Amazon RDS, EC2, GCE). The databases can be either SQL Server or PostgresSQL with Timescale DB. The software is typically self-hosted.
Performance metrics
Redgate Monitor collects metrics and provides drilldowns for query execution statistics, long-running queries, blocking chains, and plan-level details, with estate overviews for trends and outliers. The documentation groups this under performance and activity monitoring and performance diagnostics.
Management
Redgate’s management tools focus on daily DBA administration. It includes backup and recovery, multi-server scripting, documenting and visualizing dependencies, index maintenance, and classifying data across the estate.
Software you may need
- SQL Backup Pro for backup/restore
- SQL Multi Script to run scripts across many servers.
- SQL Scripts Manager for the curated script library
- SQL Doc and SQL Dependency Tracker for documentation and visualization
- SQL Index Manager for index maintenance
- SQL Data Catalog to classify and label sensitive data
Note: Redgate Monitor doesn’t perform database changes. Its REST API is read-only for data access. The PowerShell API is for Monitor configuration and annotations, not schema or data deployment.
Scalability
For growing estates, Redgate documents two scaling patterns:
Split components (Web Server, Base Monitor service, and repository database) onto separate machines as counts rise (often beyond ~50 servers).
Add additional Base Monitors when the load gets high, “200+ servers” per Base Monitor is the point where a second becomes advisable; Monitor can roll up multiple Base Monitors into one UI. (They also cite scenarios like geo/DMZ boundaries.)
For environment provisioning at scale, Redgate Clone and SQL Provision let you create lightweight, masked clones for many dev/test databases quickly; Flyway (migration-based) and SQL Compare (state-based) handle scalable change delivery when DBAs also own deployments.
Automation
Redgate Flyway provides CI and CD automation for database change management across multiple platforms.
Compliance
Compliance coverage is built around classifying sensitive data and controlling how copies are created for non-production use.
- SQL Data Catalog helps teams identify and track sensitive data.
- Data Masker applies policy-driven masking rules before data moves downstream.
- SQL Provision is designed to bring cloning and masking together, so development and testing environments are created in a governed way.
Reporting
Redgate Monitor creates reports. They are customized with tiles, scheduled, and emailed as PDFs. According to the docs, built-in reports are available for SQL Server targets; for broader customization or branding, teams commonly use the read-only REST API to pull data into their own BI tooling and generate branded outputs. Scheduling is done in the UI; the REST API is for data retrieval rather than creating reports.
For fully branded or bespoke outputs, export data via the read-only REST API to your BI tools. Scheduling is done in the UI.

4. IDERA
IDERA offers a SQL Server focused toolset with monitoring, diagnostics, and adjacent admin utilities. This section highlights the pieces DBAs use most and how they fit day to day work.
Best for: SQL Server-centric estates (with some MySQL/MariaDB) that want deep SQL Server monitoring and diagnostics, optional wait/trace-driven tuning, and packaged tools for auditing, security checks, backup, jobs, and index maintenance.
Free trial: Free trials are available (SQL Diagnostic Manager advertises a 14-day trial; other products have trial pages as well).
Pricing: Generally quote-based.
Monitoring
SQL Diagnostic Manager (SQL Server) provides performance/availability monitoring, alerting, and diagnostics (desktop + web console), with history/baselines, lock/blocks/deadlock insight, AG awareness, and reporting (including SSRS deploy). SQL Diagnostic Manager for MySQL is agentless with 600+ monitors/advisors and RDS support.
Cross-platform
Coverage is strongest for SQL Server and MySQL/MariaDB. SQL DM supports SQL Server on Windows/Linux and can run/monitor in cloud VMs; the MySQL edition covers on-prem and Amazon RDS for MySQL/MariaDB. For additional engines (Oracle/Db2/Sybase), IDERA lists Precise software for multi-platform database performance monitoring separately.
Performance metrics
Out of the box: real-time and historical metrics, configurable baselines/thresholds, waits/blocks/deadlocks, Top SQL, query plan views, and workload analytics. Optional add-ons: SQL Workload Analysis (granular wait-state and top SQL analysis) and SQL Query Tuner (visual tuning, batch tuning, recommendations).
Management
IDERA leans observability + adjacent admin tools rather than schema change. For operations you’ll typically pair: SQL Safe Backup (policy-based backup/restore, compression, instant restore), SQL Enterprise Job Manager (centralized Agent job monitoring/management), SQL Defrag Manager (index maintenance), SQL Inventory Manager (discovery/ownership/alerts), and SQL Doctor (prescriptive tuning advice).
Scalability
Self-hosted architecture with a repository and consoles; designed to span hundreds of instances via agentless collection, baselines, and alert noise controls. Cloud-VM deployments are supported for hybrid estates; MySQL edition is agentless for fleet coverage.
Automation
Automation is event-driven: alert Action Responses (e.g., send as event/ServiceNow), scripts, and PowerShell can trigger workflows; backup, job, and defrag tools are policy/schedule driven. (IDERA monitoring itself doesn’t deploy schema/data changes.)
Compliance
SQL Compliance Manager provides policy-based auditing, alerting, and reporting for SQL Server activity and sensitive columns (framework mappings called out include PCI DSS, GDPR, HIPAA, SOX, etc.). SQL Secure analyzes effective permissions, flags risky settings, and generates audit-friendly reports/recommendations. These tools support compliance processes; they don’t certify compliance on their own.
Reporting
SQL DM supports built-in reports (and SSRS deployment) for health/performance; other tools include scheduled and templated reports (e.g., compliance/security summaries). Teams needing custom/branded outputs commonly export to SSRS or external BI.

5. Datadog
Datadog is strongest when you need one place to connect query behavior with application and host signals. It complements DBA toolchains rather than replacing them.
Best for teams that want a SaaS observability platform that puts database visibility alongside apps, hosts, and logs in one place.
Free trial: 14-day free trial for new accounts
Pricing: Public, usage-based pricing by product.
Monitoring
Database Monitoring (DBM) is read-only and surfaces historical Query Metrics and per-statement Query Samples (with explain plans), plus host/managed-service metrics. It highlights long-running and blocking queries and ships out-of-the-box dashboards for managed services like Amazon RDS and Azure SQL. You can add Deployment Tracking markers to correlate changes with behavior.
Cross-platform
DBM supports self-hosted and managed PostgreSQL, MySQL, SQL Server, Oracle, MongoDB, and Amazon DocumentDB, and integrates with cloud databases such as Amazon RDS/Aurora, Google Cloud SQL, and Azure SQL (incl. Managed Instance). Datadog is delivered as SaaS with an Agent you deploy close to each database.
Performance monitoring & diagnostics
Datadog correlates traces, metrics, logs, RUM, and database telemetry to localize latency, errors, and resource usage across services. Read-only diagnostics span APM and Continuous Profiler, with SLOs and alerting to track performance over time.
Management
Datadog is observability, not database lifecycle management—no native backups, index jobs, or user/patch management. Operationally, teams use Monitors/Alerts, Infrastructure Monitoring, Logs, Notebooks, and Incident Management; actions can be triggered externally via Workflow Automation.
Scalability
Control plane scale is handled by Datadog’s hosted backend. Collection scales via Agents (VMs, containers, Kubernetes). For large estates, govern growth with log indexing/exclusion filters, quota/usage controls, and documented API rate-limit increases; place agents near databases and use tags for roll-ups.
Compliance
Datadog doesn’t ship database policy packs or enforcement.
Reporting
Dashboards can be scheduled as high-density PDF reports (email/Slack), publicly shared via links, and Notebooks support narrative, data-driven write-ups. Scheduled CSV reports for Logs are available for periodic extracts.
Customization
Dashboards are highly customizable: widgets, template variables (with saved views), and JSON editing per widget/dashboard. You can export data via APIs or build Notebooks for bespoke views; the docs don’t advertise full white-label branding removal.
The Right Solar Winds Alternative for You
Choosing the right database monitoring platform depends on your environment, scale, and compliance needs. The five options covered here each bring strengths that make them worthy SolarWinds alternatives. Find the one that best suits your organization’s needs.
To help you, the table below gives a quick side-by-side comparison of the top SolarWinds alternatives for database monitoring.