Scaling MSP Operations with Centralized Monitoring at Atea

Centralized monitoring with Atea

As a leading IT company in the Nordics, Atea manages several hundred client databases as a Managed Service Provider. A team of eight Database Administrators cares for the clients. Steinar Wold, Database Administrator (DBA) and Senior Consultant, is responsible for dbWatch and MS SQL.  

Key Advantages of dbWatch

  • Centralized monitoring and management of all customer databases from a single dashboard, eliminating the need for multiple logins.
  • Proactive issue resolution, addressing potential problems before they affect customers.
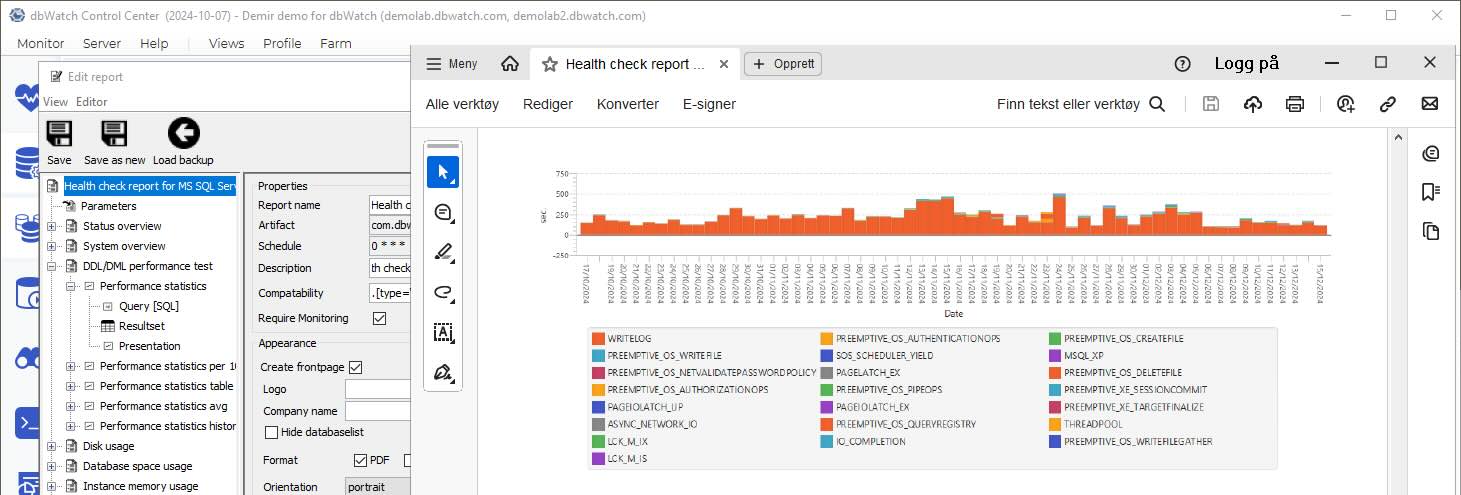
  • Automated Service Level Agreement (SLA) reporting, saving time and ensuring consistent delivery of client reports.
  • Seamless management of databases across both on-premises and cloud environments.

dbWatch has a strong focus on responsiveness and delivering practical solutions.

Scaling Databases as a Managed Service Provider

In 2021, Atea managed databases for multiple clients. Atea’s environment was large. Several customers had over 100 database instances. The client’s databases were located in diverse physical and cloud locations. The DBA team managed the database instances from the customer’s environment. This involved jumping through a variety of log-in hoops every time they needed to access a different environment.

The DBA team relied on IBM’s Xymon and Microsoft SCOM for monitoring and management. However, when a database issue occurred, there was sometimes a delay before action could be taken. The process began with SCOM detecting the problem or a customer noticing it and creating a ticket. Only then could someone review the ticket and assign it to a DBA, a sequence that sometimes took several hours.

Because the environment grew with each new client, the work became increasingly labor-intensive, making it challenging for DBAs to track manual actions across each database instance. The team was nearing the point of being overwhelmed by the volume of manual tasks, with their efforts becoming more reactive over time.

dbWatch helps us be proactive, resolving problems before customers are even aware of them.

Finding a Cost-effective Database Monitoring Solution

While looking for a monitoring solution, Atea needed to keep a strict budget. Steinar says, “We found many tools too expensive for our environment.”

During their research, dbWatch quickly emerged as their top choice. It fit comfortably within their budget and was more cost-effective than many other tools. The DBA team particularly liked its intuitive user experience, making it a clear favorite.

Time-Saving and Proactive Work

Adopting dbWatch transformed how Atea manages its database operations. The team replaced manual workflows with best-practice templates. This transformation improved the team’s efficiency and helped them improve their service to their clients.

The proactive monitoring capabilities of dbWatch have allowed the team to anticipate and address issues before they impact customers, reducing downtime and ensuring smooth database performance across hundreds of instances. Beyond the functionality, the DBA team is particularly impressed with the service they receive from dbWatch. Steinar says, “The vendor support is good, with a strong focus on responsiveness and delivering practical solutions.”

Operational Efficiency

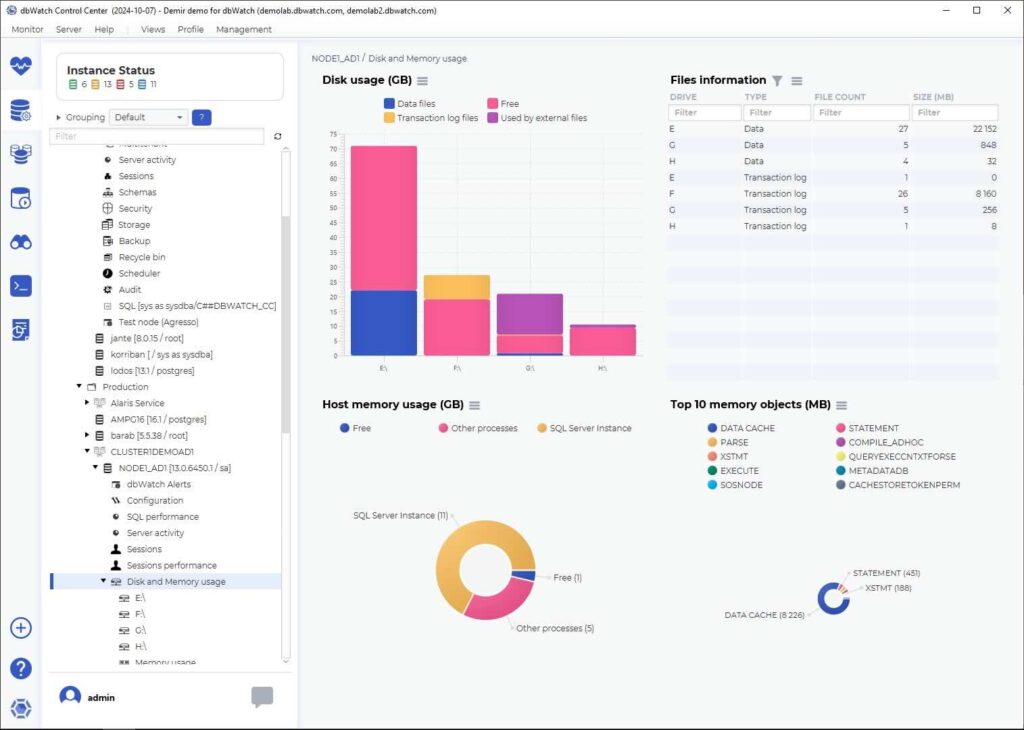
dbWatch has significantly streamlined the DBA’s workflows. Former manual tasks, like tracking system health and resolving minor issues, are now automated or simplified, freeing up the DBA team to focus on higher-value activities. The centralized monitoring ensures that even the smallest anomalies are flagged early, reducing the time spent searching for the root cause of potential issues.

They no longer need to log in to each individual environment. Instead, they can monitor and manage each individual customer on one screen without having to log in. In addition, Because of dbWatch’s cross-platform capabilities, Atea can easily accommodate all their customer’s databases, including MS SQL, Oracle on Windows and IBM/Power (AIX), PostgreSQL and mySQL.

They have used templates to standardize their approach across diverse client environments, ensuring consistency while adapting to specific client requirements. This standardization reduces manual effort and minimizes the error margin, enhancing the reliability of their services.

dbWatch excels at managing databases across multiple locations, outperforming other tools we previously tried.

Using the dbWatch alarm chain is much shorter. They have set alarm and alert thresholds, which notify them via email or text notifications when they are triggered. There’s no longer a long ticketing process when there’s an issue; they can fix it fast.

The DBA team has a better complete overview. They see the potential issues before they become problems, giving them time to plan their workflow. This proactive approach resolves issues before they escalate. Now, it’s rare for customers to see a problem.

An example screen shot related to tracking usage in dbWatch.
An example of how DBA teams can track disk usage with dbWatch.

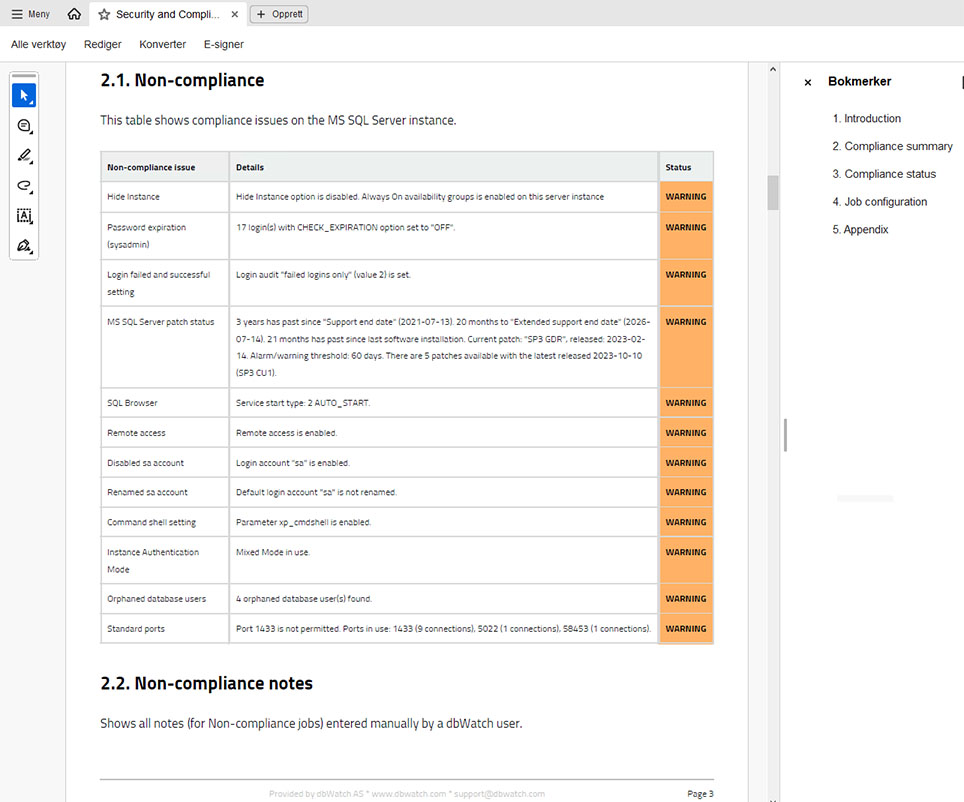
Automated Service Level Agreement Reporting

Previously, there was no time to give customers individual reports. However, dbWatch automates reports, so clients can now receive the data they want at the interval of their choice. Steinar says, “We simplify reports for customers, tailoring them to their needs if they require something different.” The reports are white labeled, so Atea’s name and branding are sent to their customers.

Before dbWatch, generating monthly SLA reports for every customer was impossible. Now, it’s something we do consistently.

The DBA team invests time at the beginning of the process. They check which reports the customers need and make sure that the customer has the knowledge to read the reports. While some find reports too technical, others want a full report on database health.

After the DBA sets up the information issued in the report, they automate the time interval and enter the relevant email address. Then everything takes care of itself.

A list of the different reports available in dbWatch.
The Report Wizard helps DBA Teams generate and deliever customized reports automatically.

Scalability Allows for Growing Database Business

Now that the DBA team no longer relies on manual scripting for monitoring jobs, they have more time for proactive work. As mentioned above, they’re also able to see what work needs to be done well ahead of the issue.

The since they started using dbWatch, the DBA team has built up a successful business branch with a high ROI. As the business expands, they can easily add customers from multiple platforms to their environment.

Atea Managed Services (AMS) offers 24/7 database support. During out-of-office hours, dbWatch tracks database status and sends the responsible DBA warnings and alarms. Their DBAs specialize in MS SQL and Oracle, but they can also manage other platforms using dbWatch, so only one DBA needs to be on call.

International dbWatch Rollout

In Norway, a dedicated team of eight specialists has made the database management products very successful. They offer managed database services from basic to premium or even premium plus, as well as a 24/7 service for operational databases.  

They have now formed a company-wide DBA group dealing only with databases. The group is starting to roll out similar database management services in all their regions: Denmark, Finland, and Sweden. The group meets weekly with the other DBAs, teaching them how to use dbWatch. They’re working towards scaling up their international DBA services as profitable as Norway’s arrangement.

Future Database Ideas

The Norwegian DBA team continuously seeks ways to improve customer service. They are exploring additional dbWatch packages and add-ons, including the Cloud Router to strengthen client security and the Performance Package to optimize performance tuning further.

About Atea

Atea is recognized as one of Norway’s leading IT companies, collaborating with customers and partners to shape their IT landscape. The company offers a comprehensive range of products and services, leveraging its extensive expertise to support businesses designing, implementing, operating, and maintaining critical IT infrastructure. Atea’s certified consultants and advisors deliver tailored solutions, guiding businesses through every step of the process to ensure operational success and maximize returns.

With over 50 years of experience, Atea has played a pivotal role in advancing Norway’s IT sector. Its roots trace back to the founding of Merkantildata in 1968, a trailblazer in the information technology industry. Merkantildata became Norway’s leading supplier of infrastructure services and was listed on the Oslo Stock Exchange in 1985. Established in 2009, Atea has since expanded its footprint through mergers, acquisitions, and organic growth, securing a robust presence across the Nordic and Baltic regions.

Discover Reporting

Learn how to use dbWatch to cover all your reports

Database Reporting Software: dbWatch Control Center

Screenshot of dbWatch databse reporting tool

Database reporting software can save weeks of manual work. Instead of assembling reports by hand for every stakeholder, you define what you need once and let the software collect and present the data for you. A good solution will also offer email integrations, so reports are sent directly to the right people on a schedule.

Most reporting software comes with standardized reports that give you a solid view of your environment’s state. Other software also let you tailor reports to show more detail or create your own from scratch.

Some platforms go further and let you build fully custom reports on top of whatever you can query in your databases. dbWatch is one of those tools: it was created to remove the pain of manual reporting. In dbWatch, if you can query it, you can report on it.

This blog walks you through how to use dbWatch as database reporting software and highlights some useful reporting features that can be easily overlooked.

Before we dive into how dbWatch works, it’s worth briefly looking at why database reporting software matters in the first place.

Why Use a Database Reporting Software?

Manual reporting is a time sink. One ‘simple’ report can mean a full day of pulling data from different systems, checking uptime, backup status, health and security, then formatting everything for the stakeholder.

Database reporting software, like dbWatch Control Center uses the monitoring data it already collects to build and deliver these reports for you. Anything you track (uptime, backups, performance, security) can be turned into a clear report for management, auditors or customers.

You define the report templates once, choose the metrics, schedule, and recipients and let the software do the rest. RPDATA Solutions, a managed service provider, uses dbWatch Control Center to save up to 12 weeks of work a year.

A sample report from dbWatch database reporting software

dbWatch Control Center provides Database Reporting Software

In dbWatch Control Center, the reporting module sits on top of the monitoring engine. As monitoring jobs run, they write history and metrics for each instance into the dbWatch repository. The reports read from this repository and turn that data into structured summaries and trend views that DBAs and stakeholders can scan quickly.

Reports templates available in dbWatch Control Center include:

  • Backup Reports: Ensure backups are successful and compliant.
  • Uptime Reports: Monitor system availability and reliability.
  • Health Check Reports: Provide detailed insights into the overall health and performance of your database systems.
  • Security and Compliance Reports: Ensure adherence to security standards and regulatory requirements (part of the Security and Compliance Package).

These templates are fully customizable. You can copy and adapt the reports or build your own. Reporting is separate from how the data is collected, so you can also point reports at any data in your database.

Some customers use dbWatch Control Center as database reporting software for their own applications. For example, reporting on application specific table and business metrics rather than only infrastructure data.

Customize dbWatch Control Center Reports

The most basic level of customization on database reports allows you to add branding. All the Managed Service Providers who use dbWatch Control Center utilize the white labeling on reports, adding their company name and logo to the report title page. The same feature is also useful for internal reporting in larger organizations.

Beyond branding, all of the built-in reports can be used as a starting point to create your own reports. Open an out-of-the-box report and use the ‘save as’ function to make a new report. Then, add or subtract parameters to personalize report outputs. Starting from the existing template saves time compared to building a report from scratch.

For example, the health check report is around 75 pages long. You can copy the report template, remove sections not relevant to you, and adjust the defaults such as the output formats and page orientation. The result is a shorter report focused on what matters to you. If someone accidently direct edits, forgetting to use the ‘save as’ function; don’t worry; there are automated report backups, and you can restore the template from an earlier version.

dbWatch Control Center also supports fully custom reports on application-specific data. Custom reports extend reporting to all data stored in the database instances. For instance, a construction company might track submitted designs and flag missing files or unresolved issues.

Automating these reports eliminates the need for you to manually extract and deliver data. It gives you time to focus on critical tasks while ensuring stakeholders receive timely, actionable information.

Want to see this in action?  Watch our step-by-step webinar on customized reports in dbWatch Control Center. 

Reporting on Cross-Platform Databases

You can run dbWatch Control Center reports on one database instance or a set of database instances. One report can include multiple database platforms. This is mainly used when you want to use one query across your entire environment. For example, we run our uptime report on multiple database types, so you’ll get uptime from your database environment, regardless of the platform.

Working with SQL databases is straightforward. When working with SQL and MongoDB, you’ll need to use Farm Data Language (FDL) to aggregate your data. However, some DBAs find it easier to use FDL for SQL queries. FDL gives you the benefit of getting structured data that is difficult to write in SQL. For example, when you need metadata that isn’t in the database.

For example, when joining data in SQL, it has to have a link to join it. In FDL, a link isn’t needed; you join it because it’s part of the same instance or section. So, sometimes, it is quicker and easier to write in FDL than it is in SQL.

In dbWatch Control Center, you have multiple options. You can mix and match with some sections that do FDL, and some are doing SQL statements.

Scheduled and Automated Reporting

Once you’ve customized your reports in dbWatch Control Center, you can use it as your central database reporting software by scheduling those reports for automatic delivery. You’ll be walked through the process with prompts like ‘report now’ or ‘set a schedule.’ Choose when to run the database reports and pick which recipients will receive the report via email. For example, you can set the system to give health check reports every Monday morning.

Once a report is scheduled, you can view and manage all scheduled reports on the server and you can run a report out of schedule as well.

Use Case: Health Check Reports

Health check reports provide a comprehensive overview of the current and historical state of the databases. Graphs and other visual data points make identifying and interpreting performance patterns easier. In many cases, health check reports help you pinpoint system issues remotely and even diagnose underlying problems without on-site intervention.

Managed Service Providers (MSPs)

Health check reports are a key tool for client communication and monitoring. Scheduled weekly or monthly reports give MSPs the ability to track database performance over time and detect anomalies by comparing recent data with historical performance benchmarks. This supports transparency and accountability in customer relationships.

Many MSP customers create their own variants of the standard health check reports. They start with the built-in template, add their branding, and the metrics they need. Tailored reports are helpful in monthly customer meetings.

In-house IT Teams and DBAs

Regular review of health check reports helps organizations identify potential risks before they become serious. Health check reports also maintain detailed historical records, invaluable when there’s an issue or you need to understand past configurations.

With automation of routine checks and diagnostics, health check reports reduce manual monitoring efforts. Technical teams can spend more time on strategic work, while the business benefits from consistent optimized database performance and actional insights delivered to stakeholders.

Using dbWatch Control Center as Database Reporting Software

dbWatch Control Center helps DBAs gather, analyze, and deliver database data. As a database reporting software, it provides standardized reports and let you customize them to match your organization’s specific needs.

You can automate recurring tasks, which reduces manual work and supports better decision-making with consistent accurate insights. The reporting features are useful for monitoring, troubleshooting, and managing business data efficiently.

Database Reporting

Discover the full functionality of dbWatch Control Center's Reporting.  February 27 at 15:00 CET.